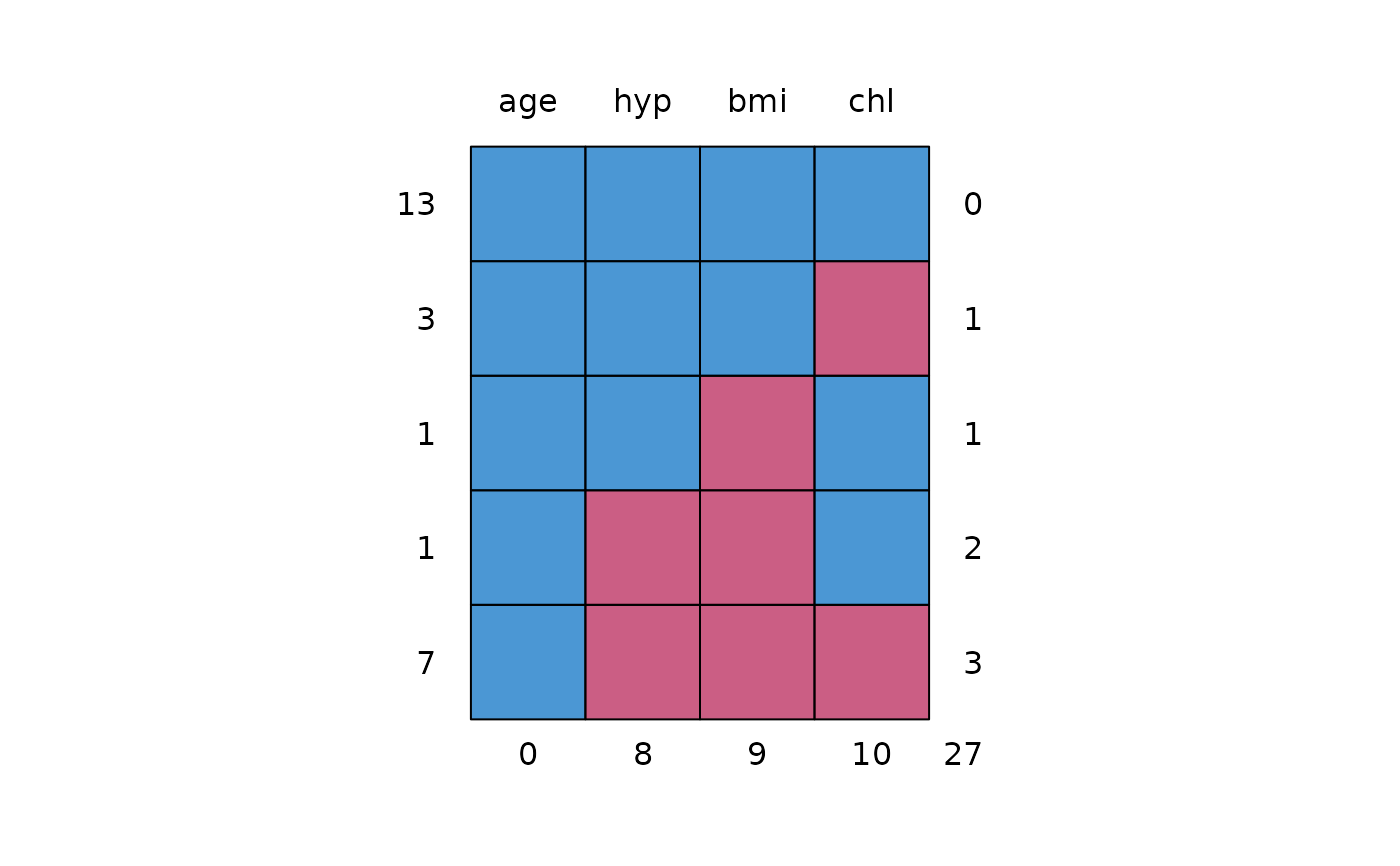
Display missing-data patterns.
Arguments
- x
A data frame or a matrix containing the incomplete data. Missing values are coded as NA's.
- plot
Should the missing data pattern be made into a plot. Default is
plot = TRUE.- rotate.names
Whether the variable names in the plot should be placed horizontally or vertically. Default is
rotate.names = FALSE.
Value
A matrix with ncol(x)+1 columns, in which each row corresponds
to a missing data pattern (1=observed, 0=missing). Rows and columns are
sorted in increasing amounts of missing information. The last column and row
contain row and column counts, respectively.
Details
This function is useful for investigating any structure of missing observations in the data. In specific case, the missing data pattern could be (nearly) monotone. Monotonicity can be used to simplify the imputation model. See Schafer (1997) for details. Also, the missing pattern could suggest which variables could potentially be useful for imputation of missing entries.
References
Schafer, J.L. (1997), Analysis of multivariate incomplete data. London: Chapman&Hall.
Van Buuren, S., Groothuis-Oudshoorn, K. (2011). mice: Multivariate
Imputation by Chained Equations in R. Journal of Statistical
Software, 45(3), 1-67. doi:10.18637/jss.v045.i03