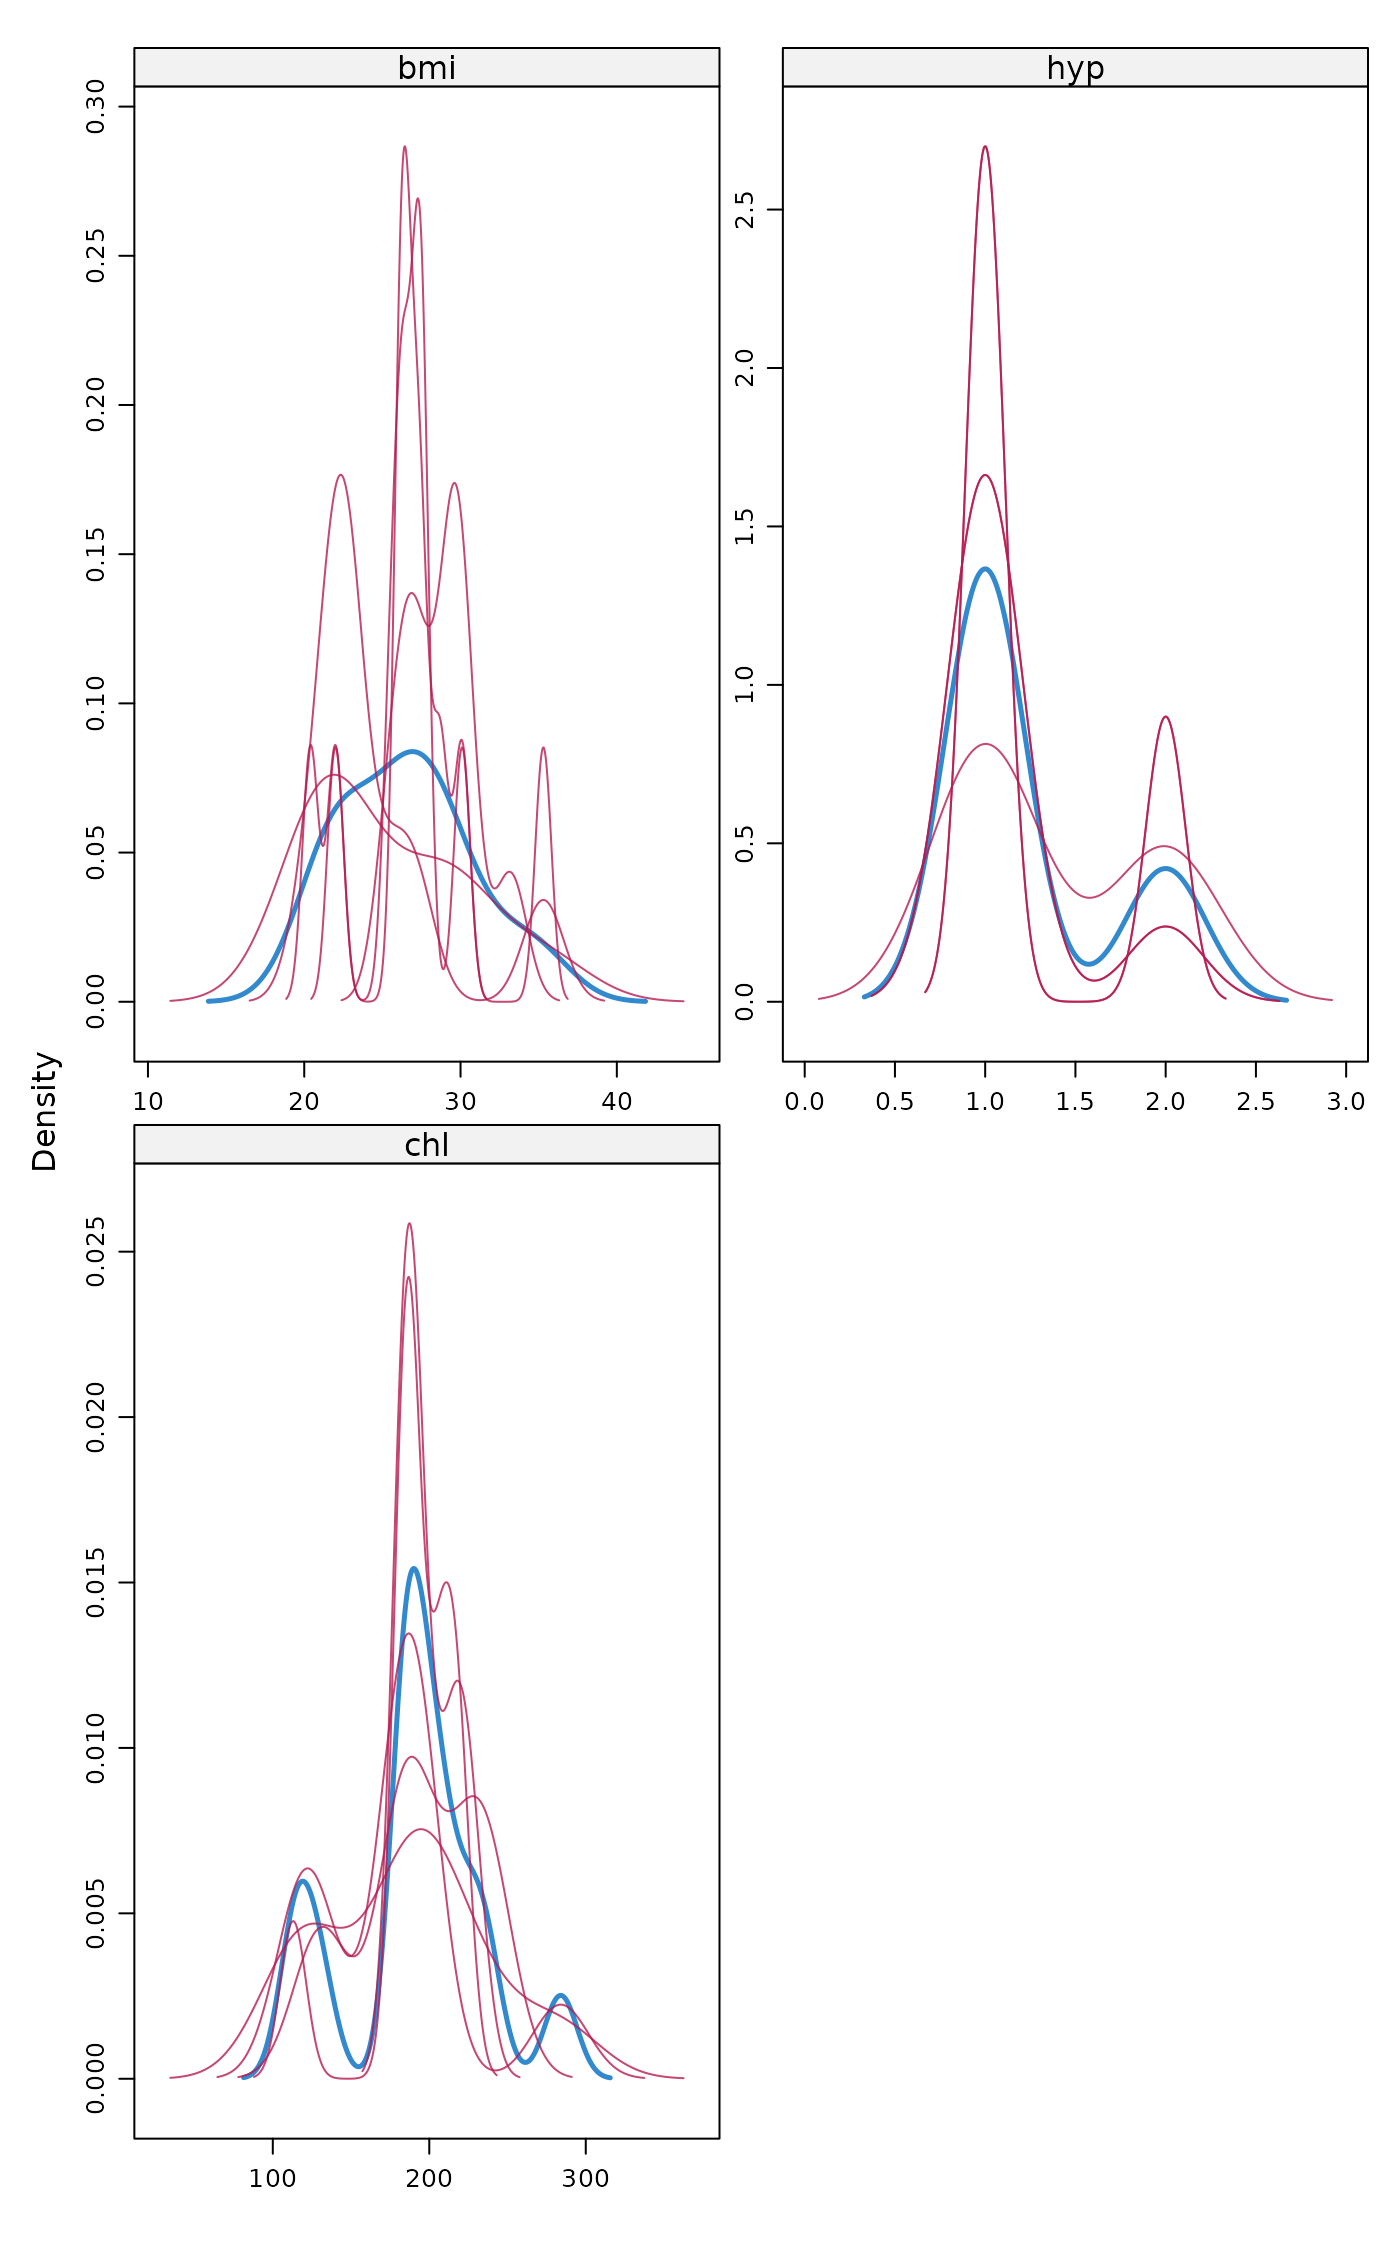
Densityplot of observed and imputed data
Value
The output of mice::densityplot and a message about the ggmice equivalent.
Examples
imp <- mice::mice(mice::nhanes, maxit = 1, printFlag = FALSE)
densityplot(imp)
#> Hint: Did you know, an equivalent figure can be created with `ggmice()`?
#> For example, to plot a variable named 'my_vrb' from a mids object called
#> 'my_mids', run:
#>   ggmice(my_mids, ggplot2::aes(x = my_vrb, group = .imp)) +
#>   ggplot2::geom_density()
#> ℹ See amices.org/ggmice for more info.
#> This message is displayed once per session.