Plot incomplete or imputed data
Usage
ggmice(data = NULL, mapping = ggplot2::aes())Arguments
- data
An incomplete dataset (of class
data.frame), or an object of classmice::mids.- mapping
A list of aesthetic mappings created with
ggplot2::aes().
Value
An object of class ggplot2::ggplot. The ggmice function returns output
equivalent to ggplot2::ggplot output, with a few important exceptions:
The theme is set to
theme_mice.The color scale is set to the
mice::mdccolors.The
colouraesthetic is set to.where, an internally defined variable which distinguishes observed data from missing data or imputed data (for incomplete and imputed data, respectively).
See also
See the ggmice vignette
to use the ggmice() function on incomplete data or imputed data.
Examples
library(ggplot2)
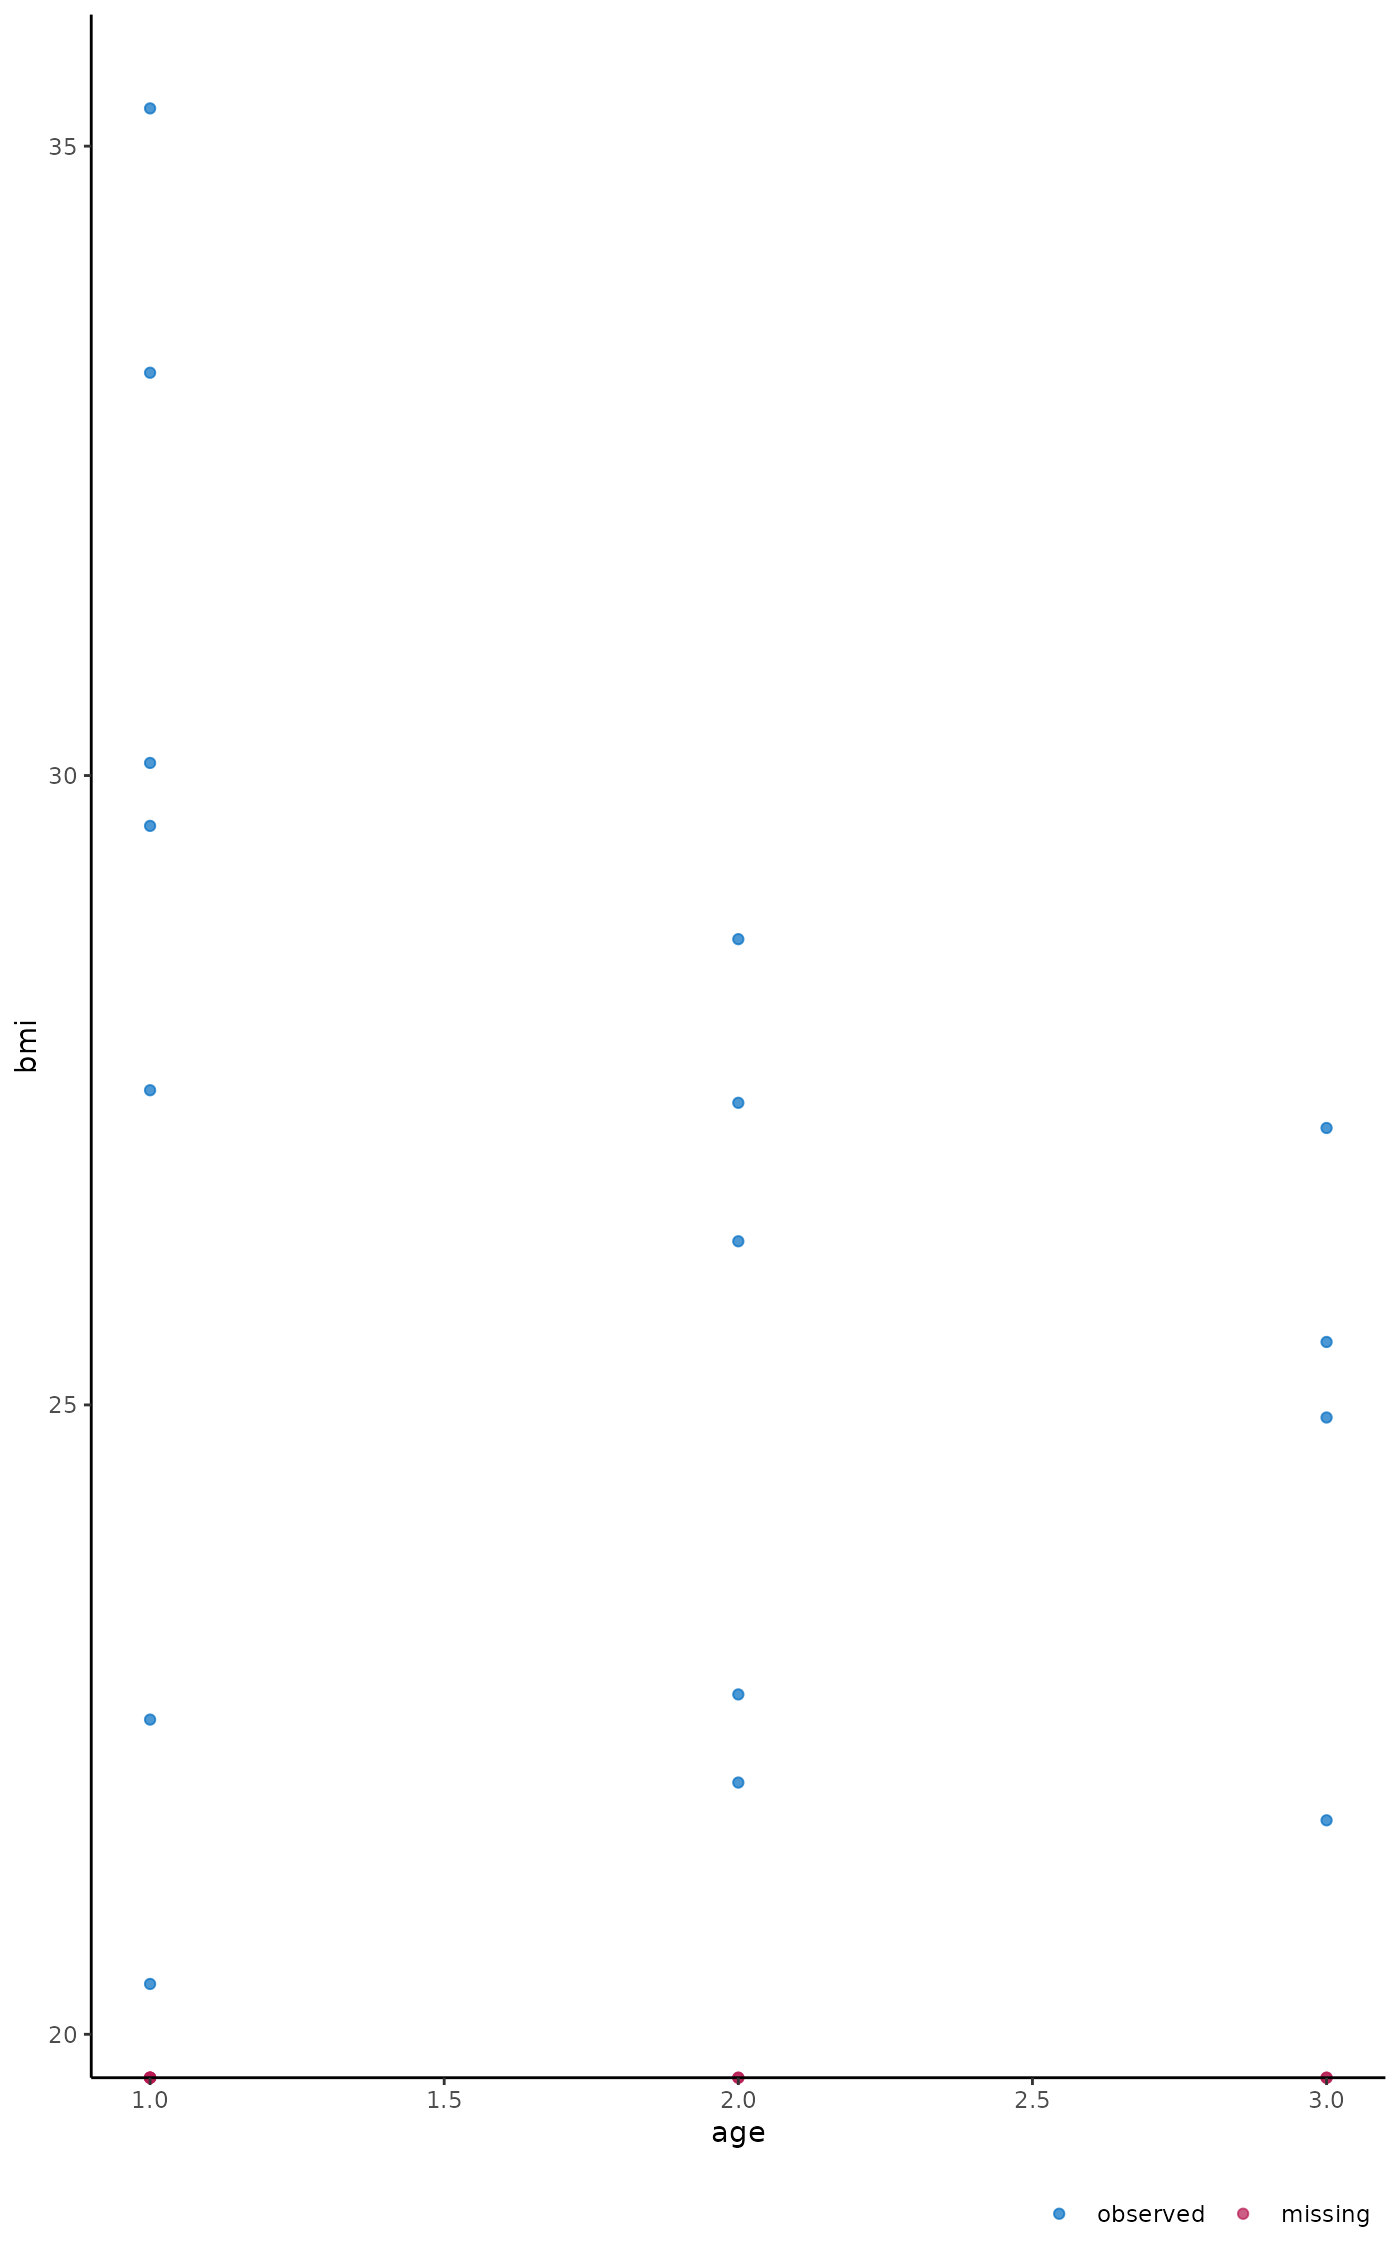
# minimal example: scatterplot of incomplete and imputed data
dat <- mice::nhanes
ggmice(dat, aes(x = age, y = chl)) + geom_point()
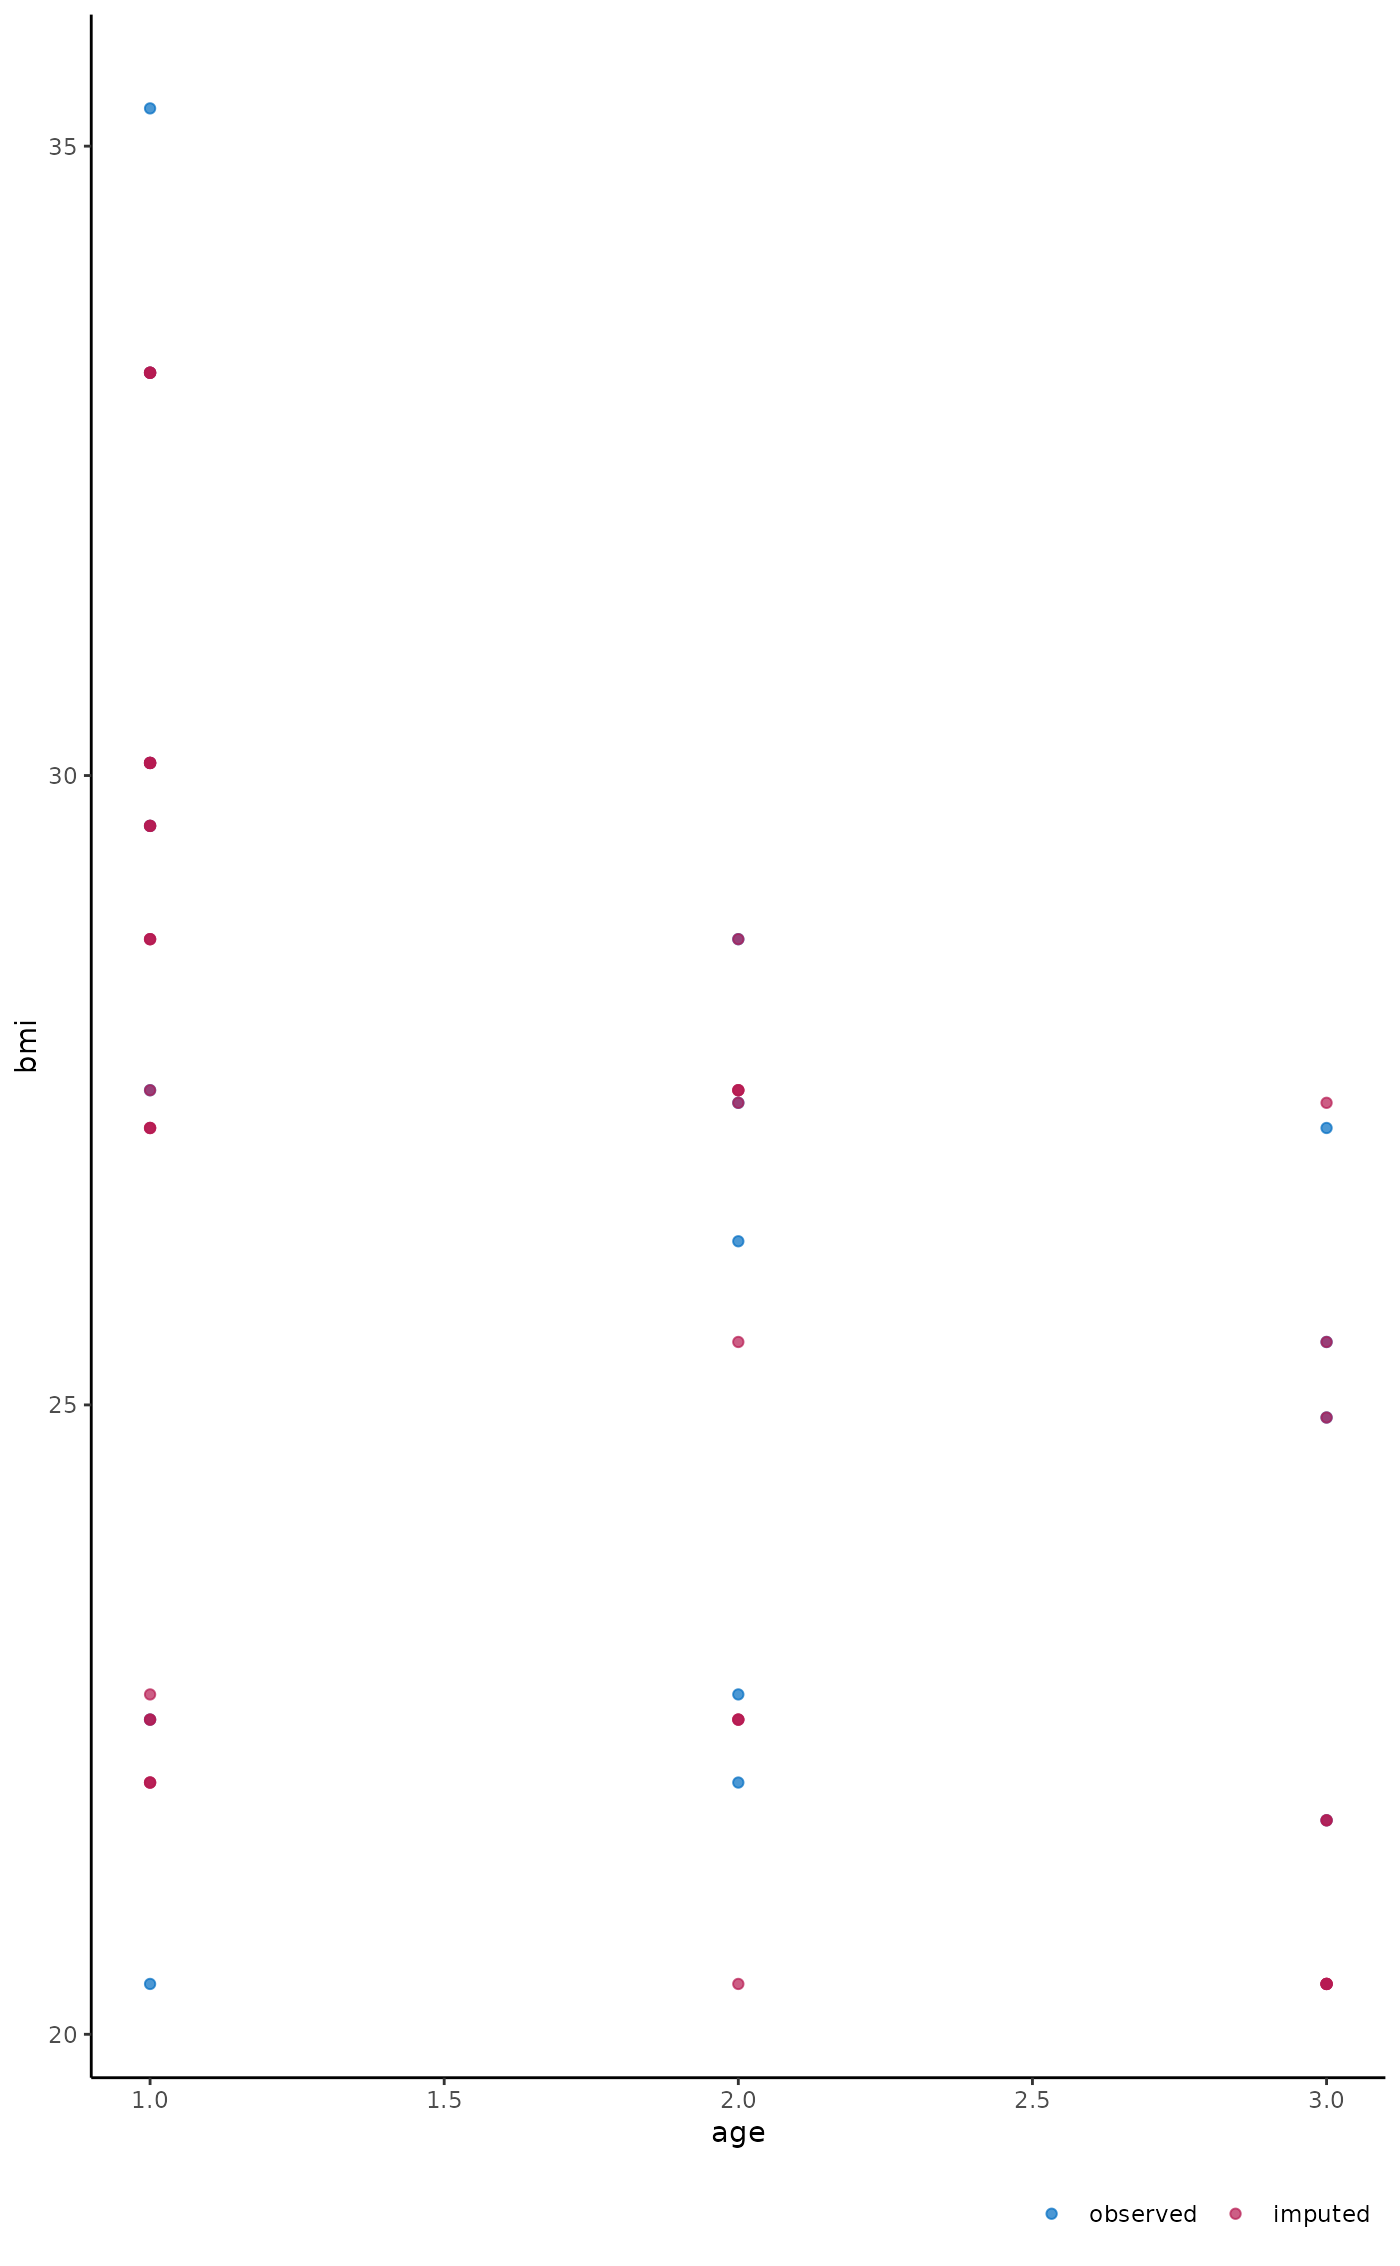
 imp <- mice::mice(dat, print = FALSE)
ggmice(imp, aes(x = age, y = chl)) + geom_point()
imp <- mice::mice(dat, print = FALSE)
ggmice(imp, aes(x = age, y = chl)) + geom_point()
 # more advanced functionality for incomplete data
# edit variable type for mixed incomplete data
dat$hyp <- factor(dat$hyp, levels = (1:2), labels = c("no hypertension", "hypertension"))
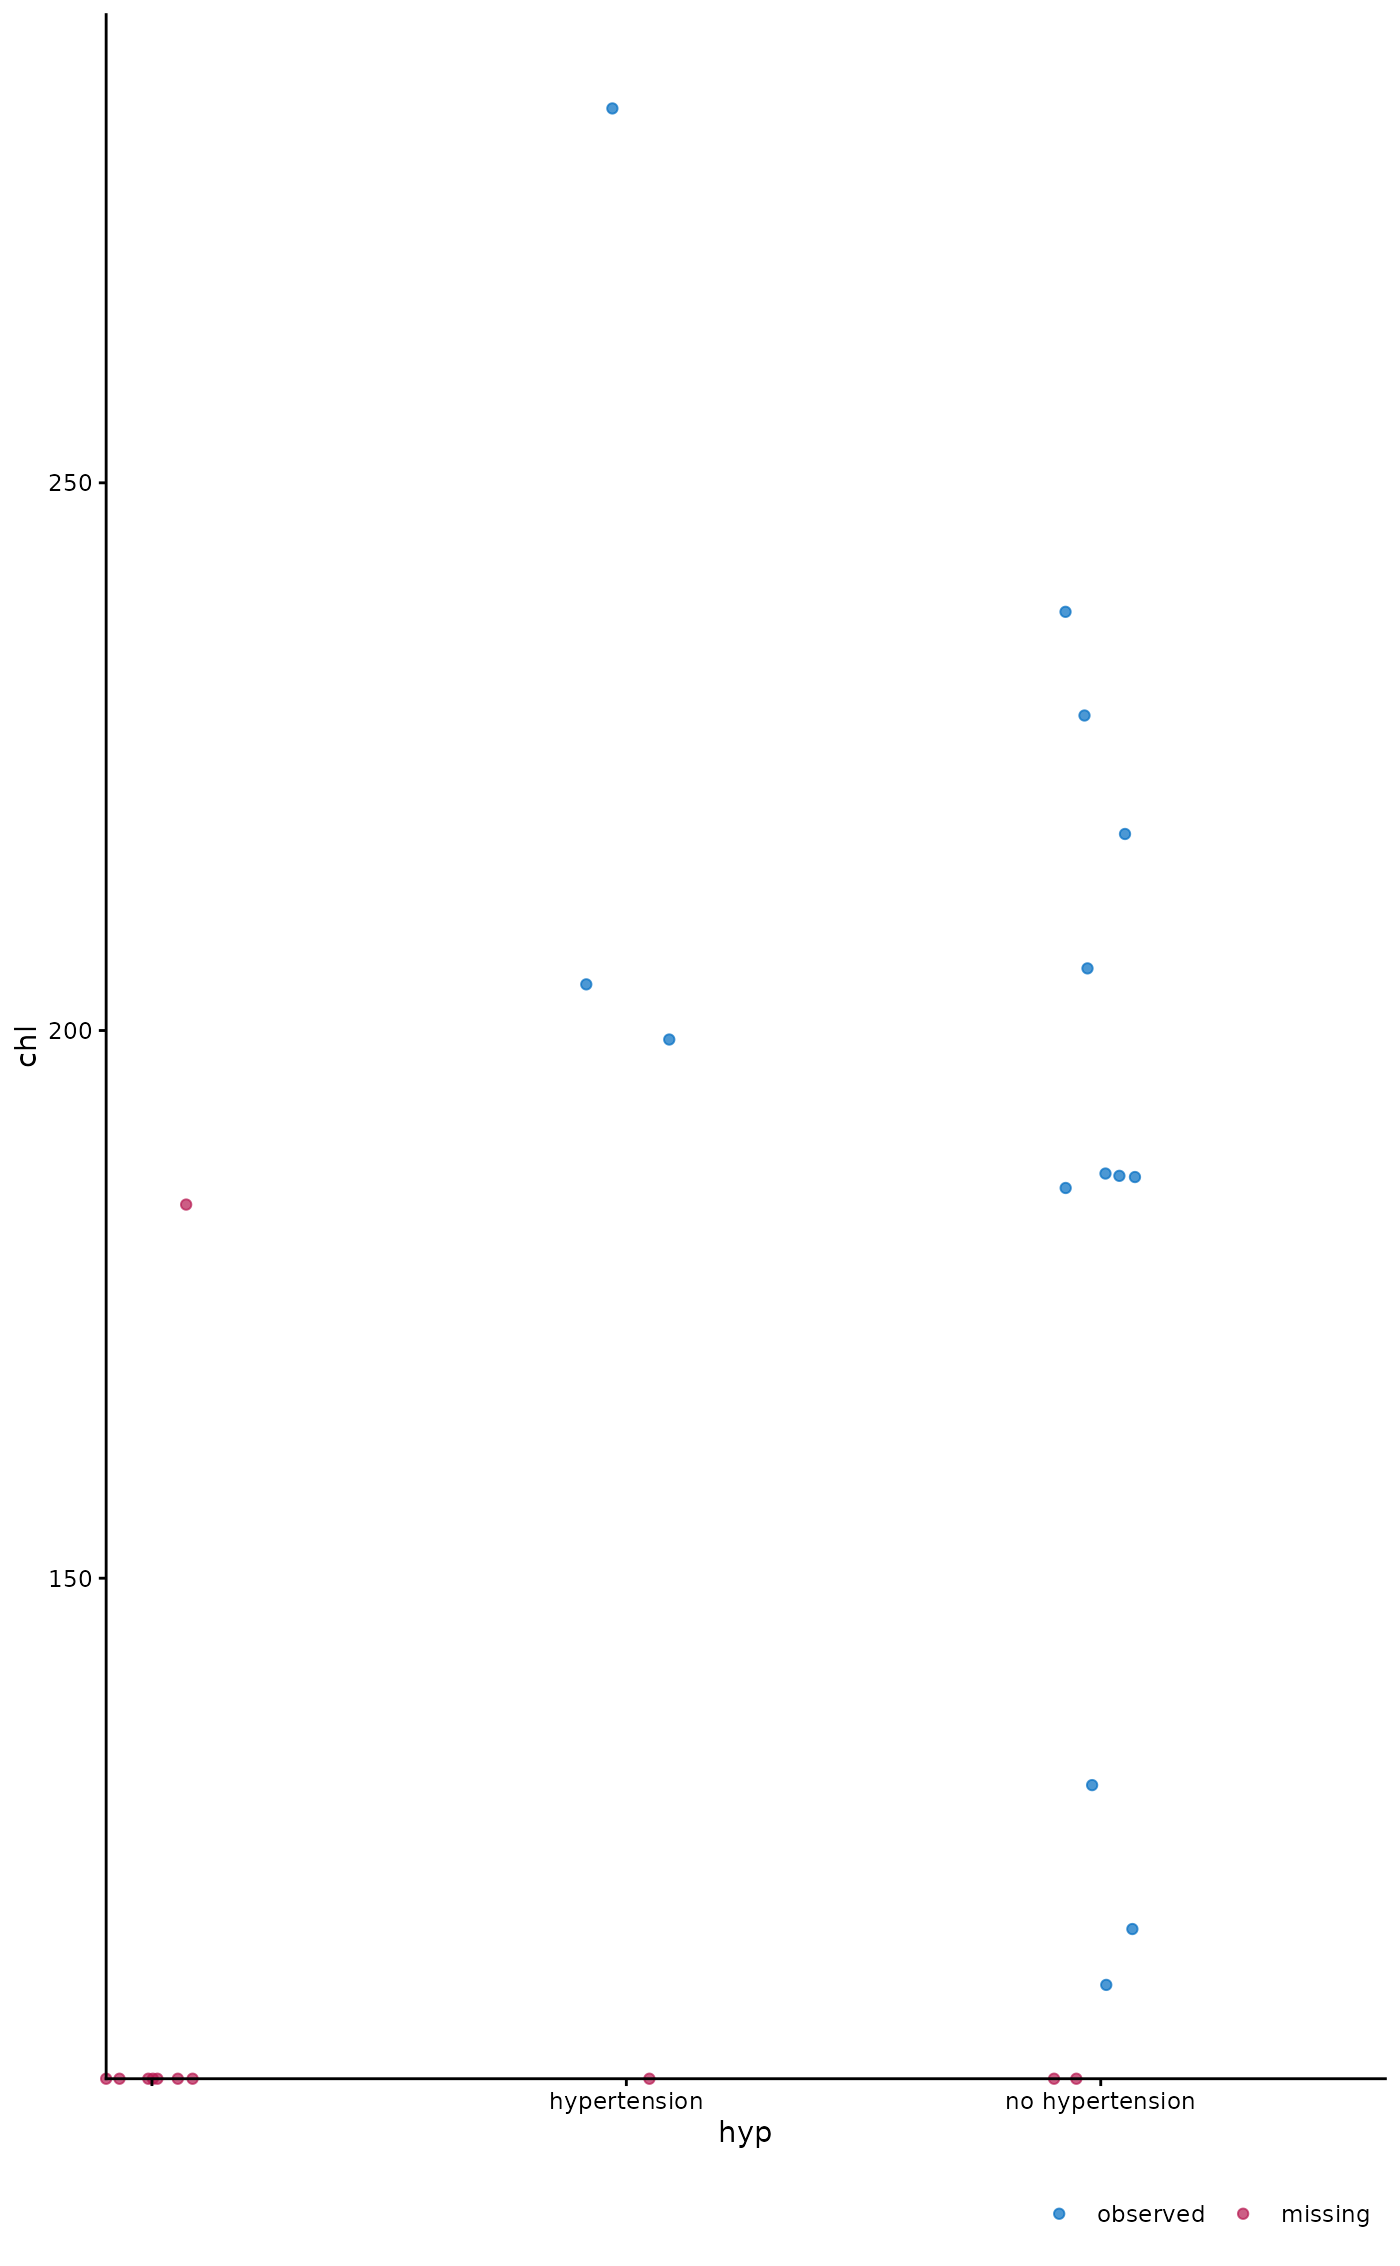
# scatterplot with categorical incomplete data
ggmice(dat, aes(hyp, chl)) + geom_jitter(width = 0.1)
# more advanced functionality for incomplete data
# edit variable type for mixed incomplete data
dat$hyp <- factor(dat$hyp, levels = (1:2), labels = c("no hypertension", "hypertension"))
# scatterplot with categorical incomplete data
ggmice(dat, aes(hyp, chl)) + geom_jitter(width = 0.1)
 # incomplete data scatterplot faceted by categorical variable
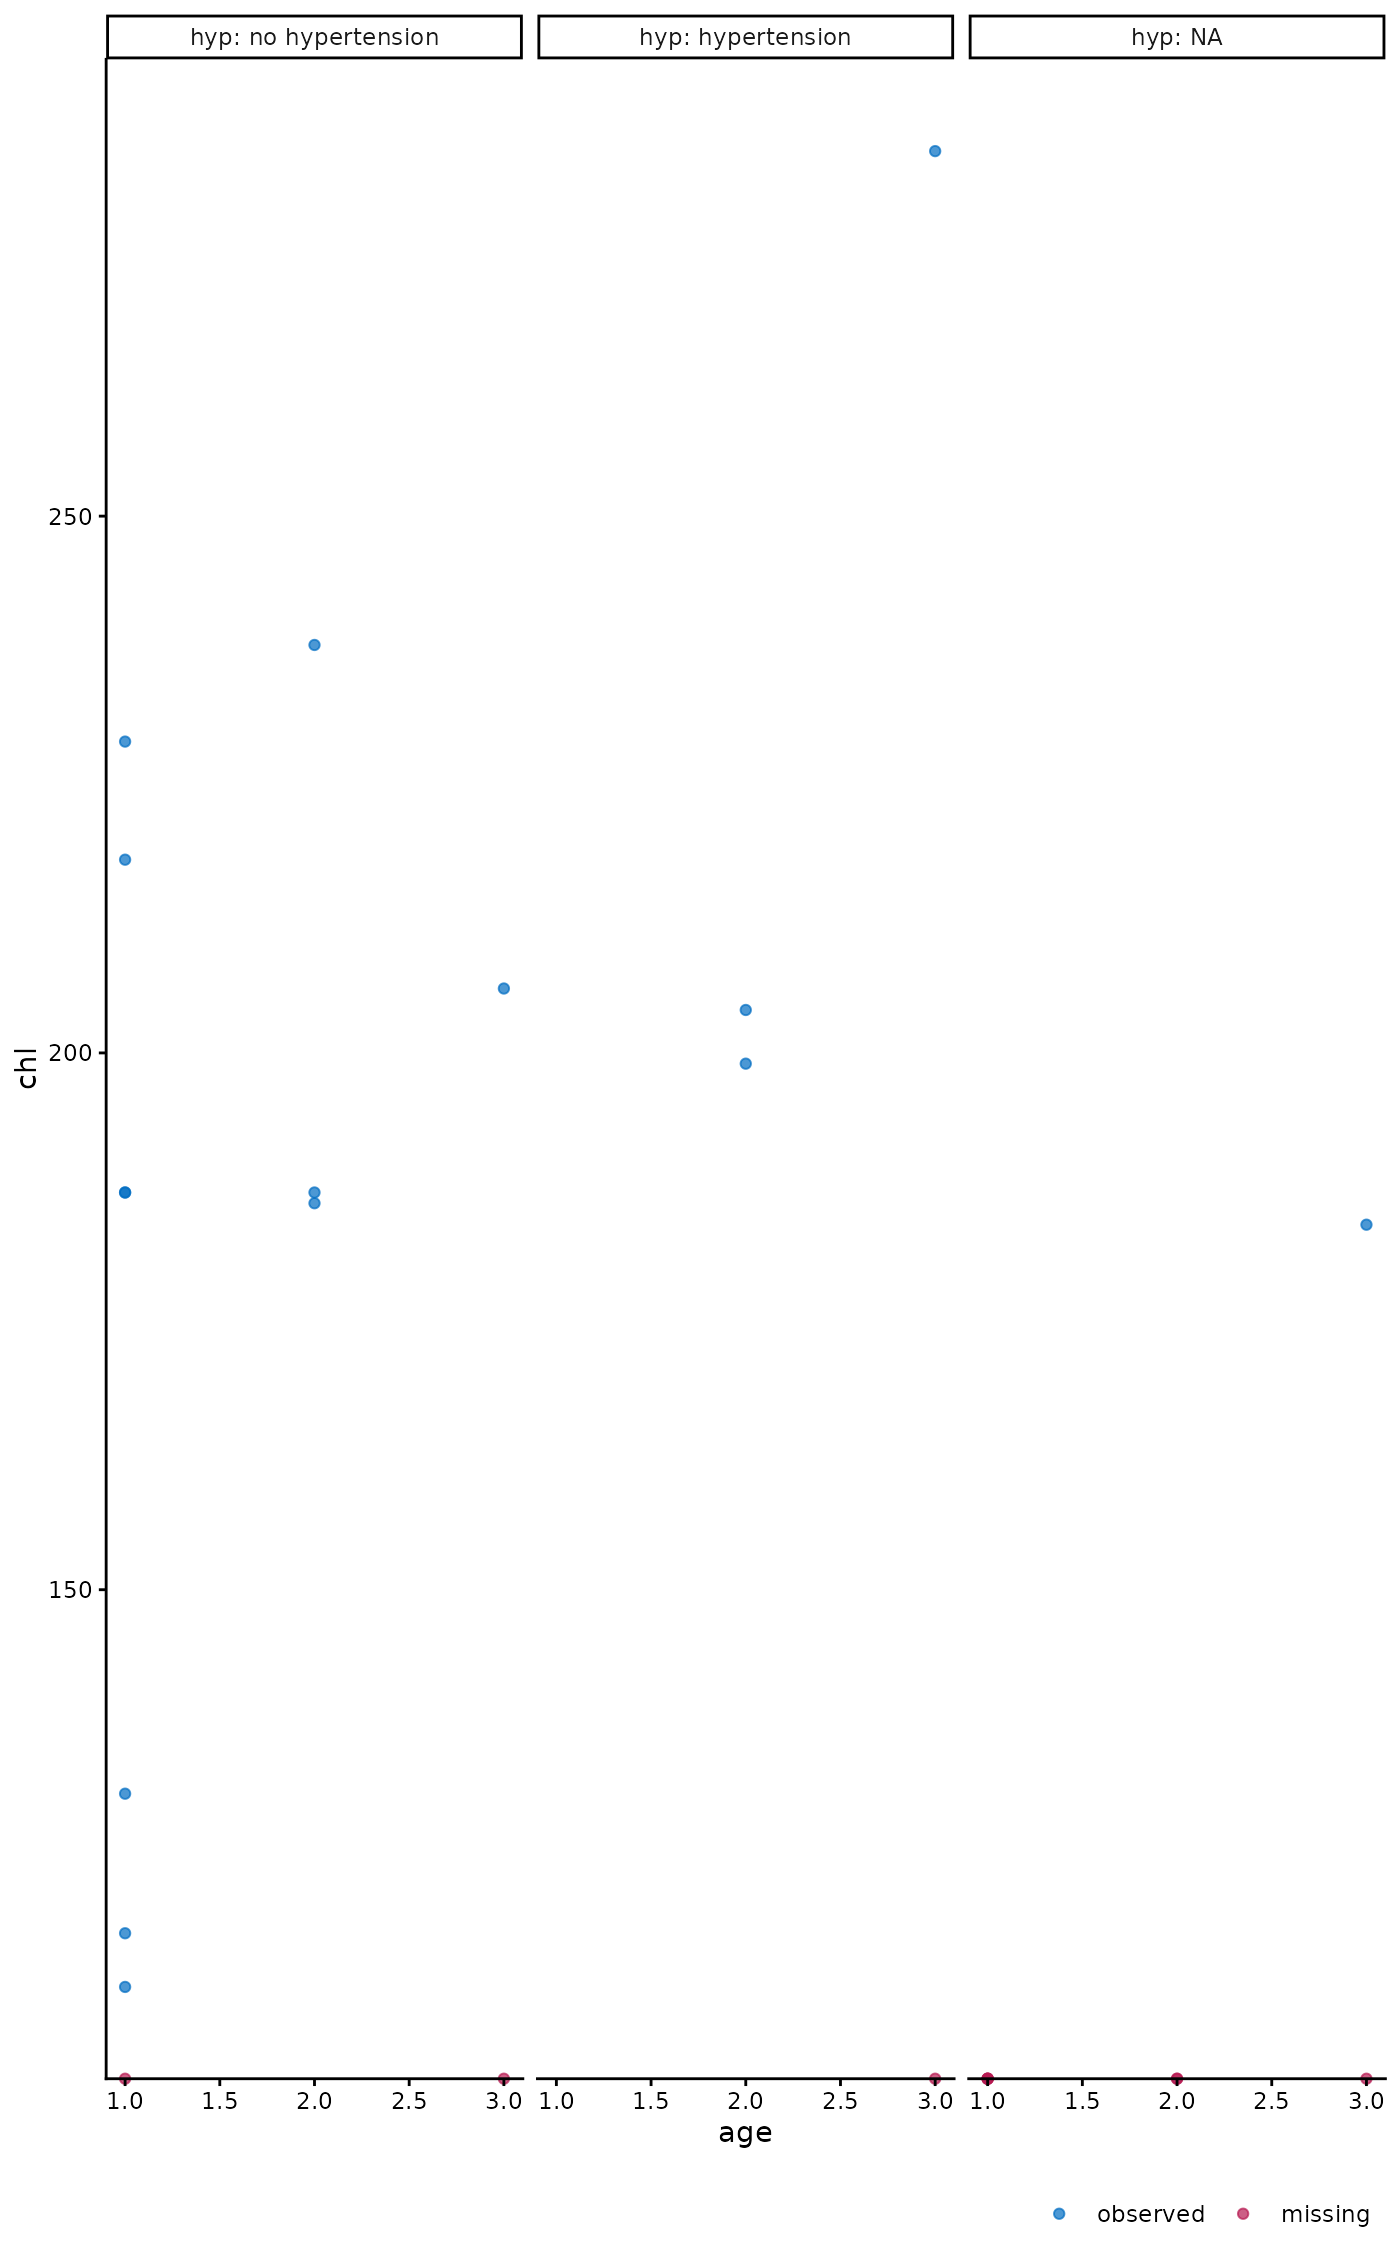
ggmice(dat, aes(age, chl)) + geom_point() +
facet_wrap(~ hyp, labeller = label_both)
# incomplete data scatterplot faceted by categorical variable
ggmice(dat, aes(age, chl)) + geom_point() +
facet_wrap(~ hyp, labeller = label_both)
 # incomplete data scatterplot faceted by missing data indicator
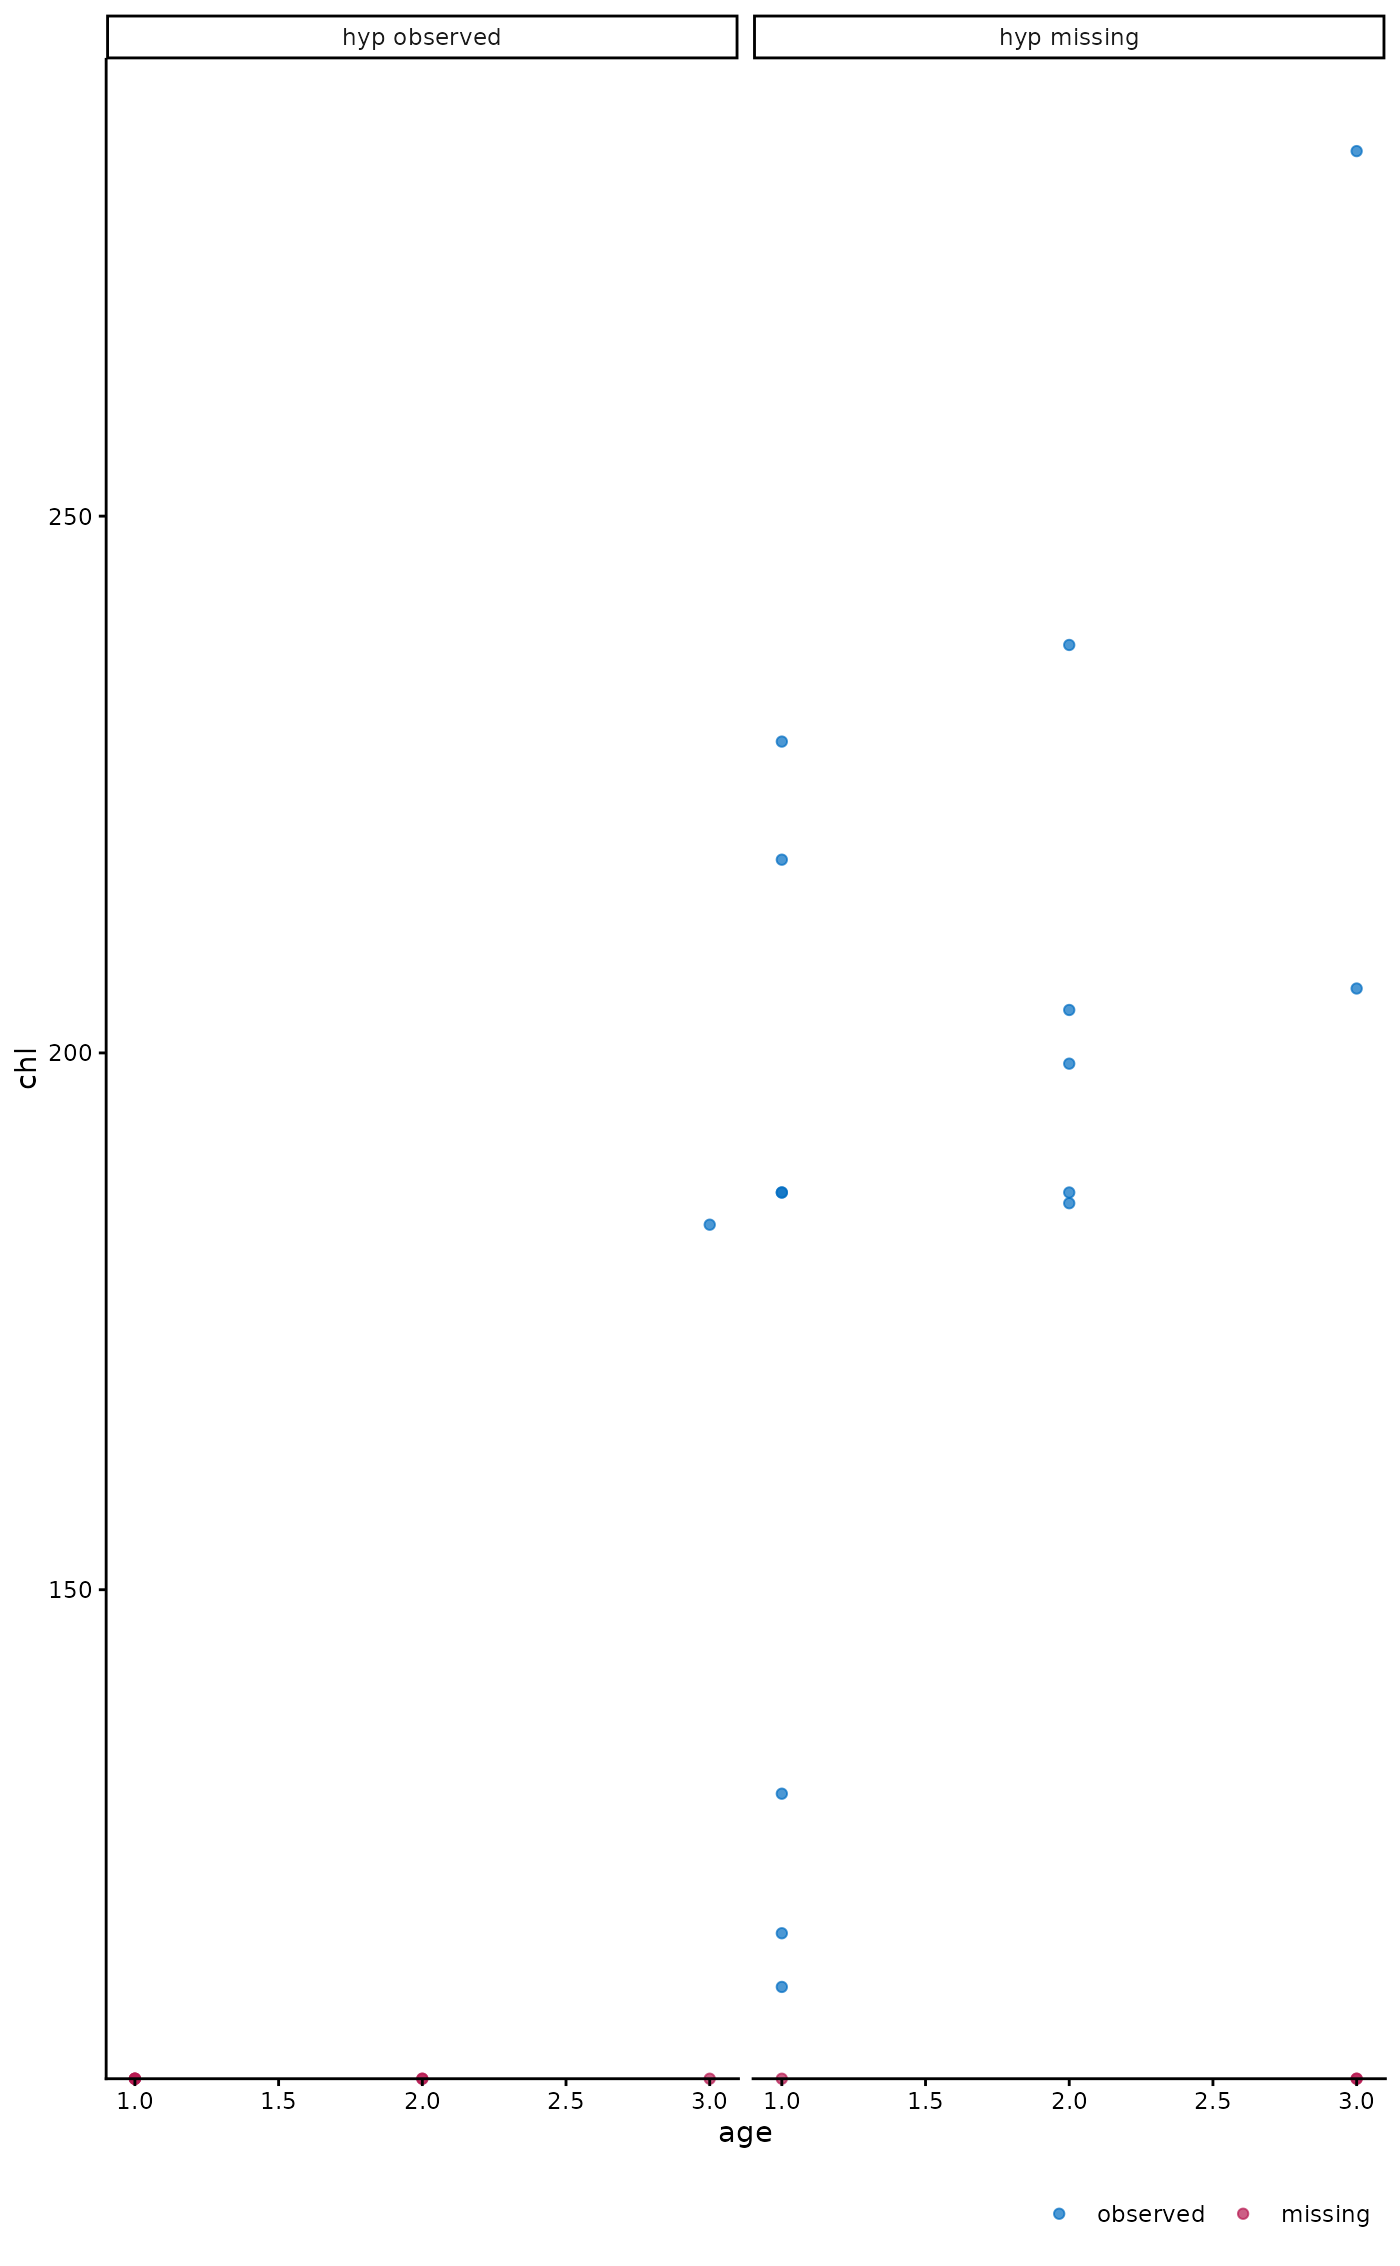
ggmice(dat, aes(age, chl)) + geom_point() +
facet_wrap(~ factor(is.na(hyp) == 0, labels = c("hyp observed", "hyp missing")))
# incomplete data scatterplot faceted by missing data indicator
ggmice(dat, aes(age, chl)) + geom_point() +
facet_wrap(~ factor(is.na(hyp) == 0, labels = c("hyp observed", "hyp missing")))
 # more advanced functionality for imputed data
# stripplot by imputation
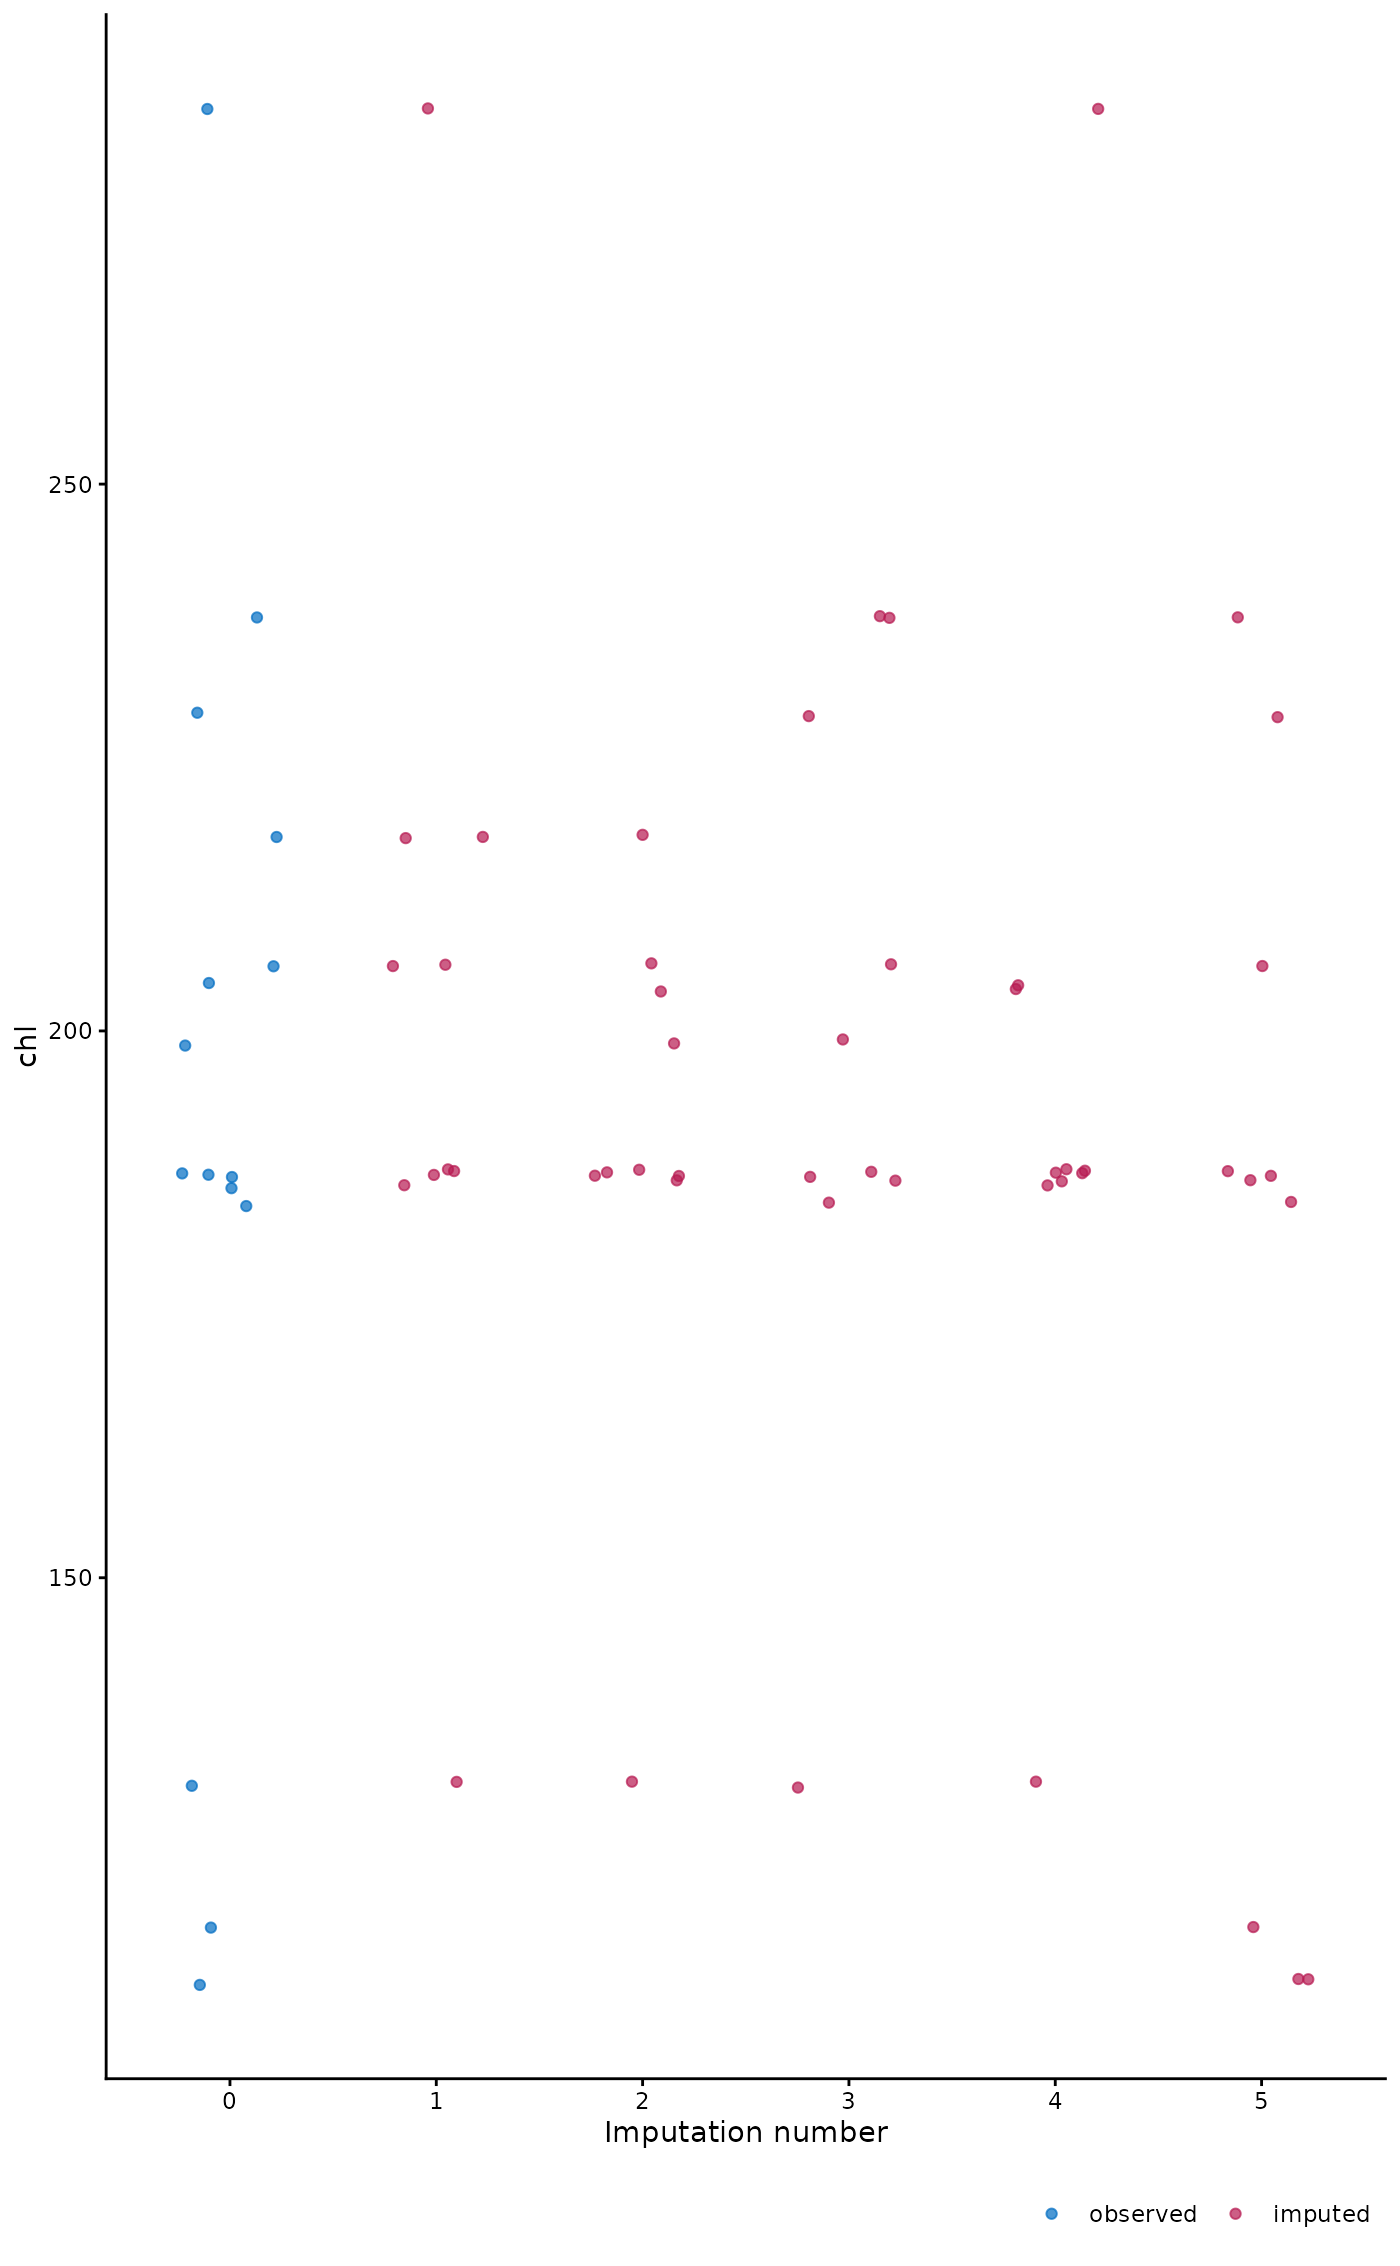
ggmice(imp, aes(x = .imp, y = chl)) + geom_jitter(width = 0.25) +
labs(x = "Imputation number")
# more advanced functionality for imputed data
# stripplot by imputation
ggmice(imp, aes(x = .imp, y = chl)) + geom_jitter(width = 0.25) +
labs(x = "Imputation number")
 # box plot by imputation
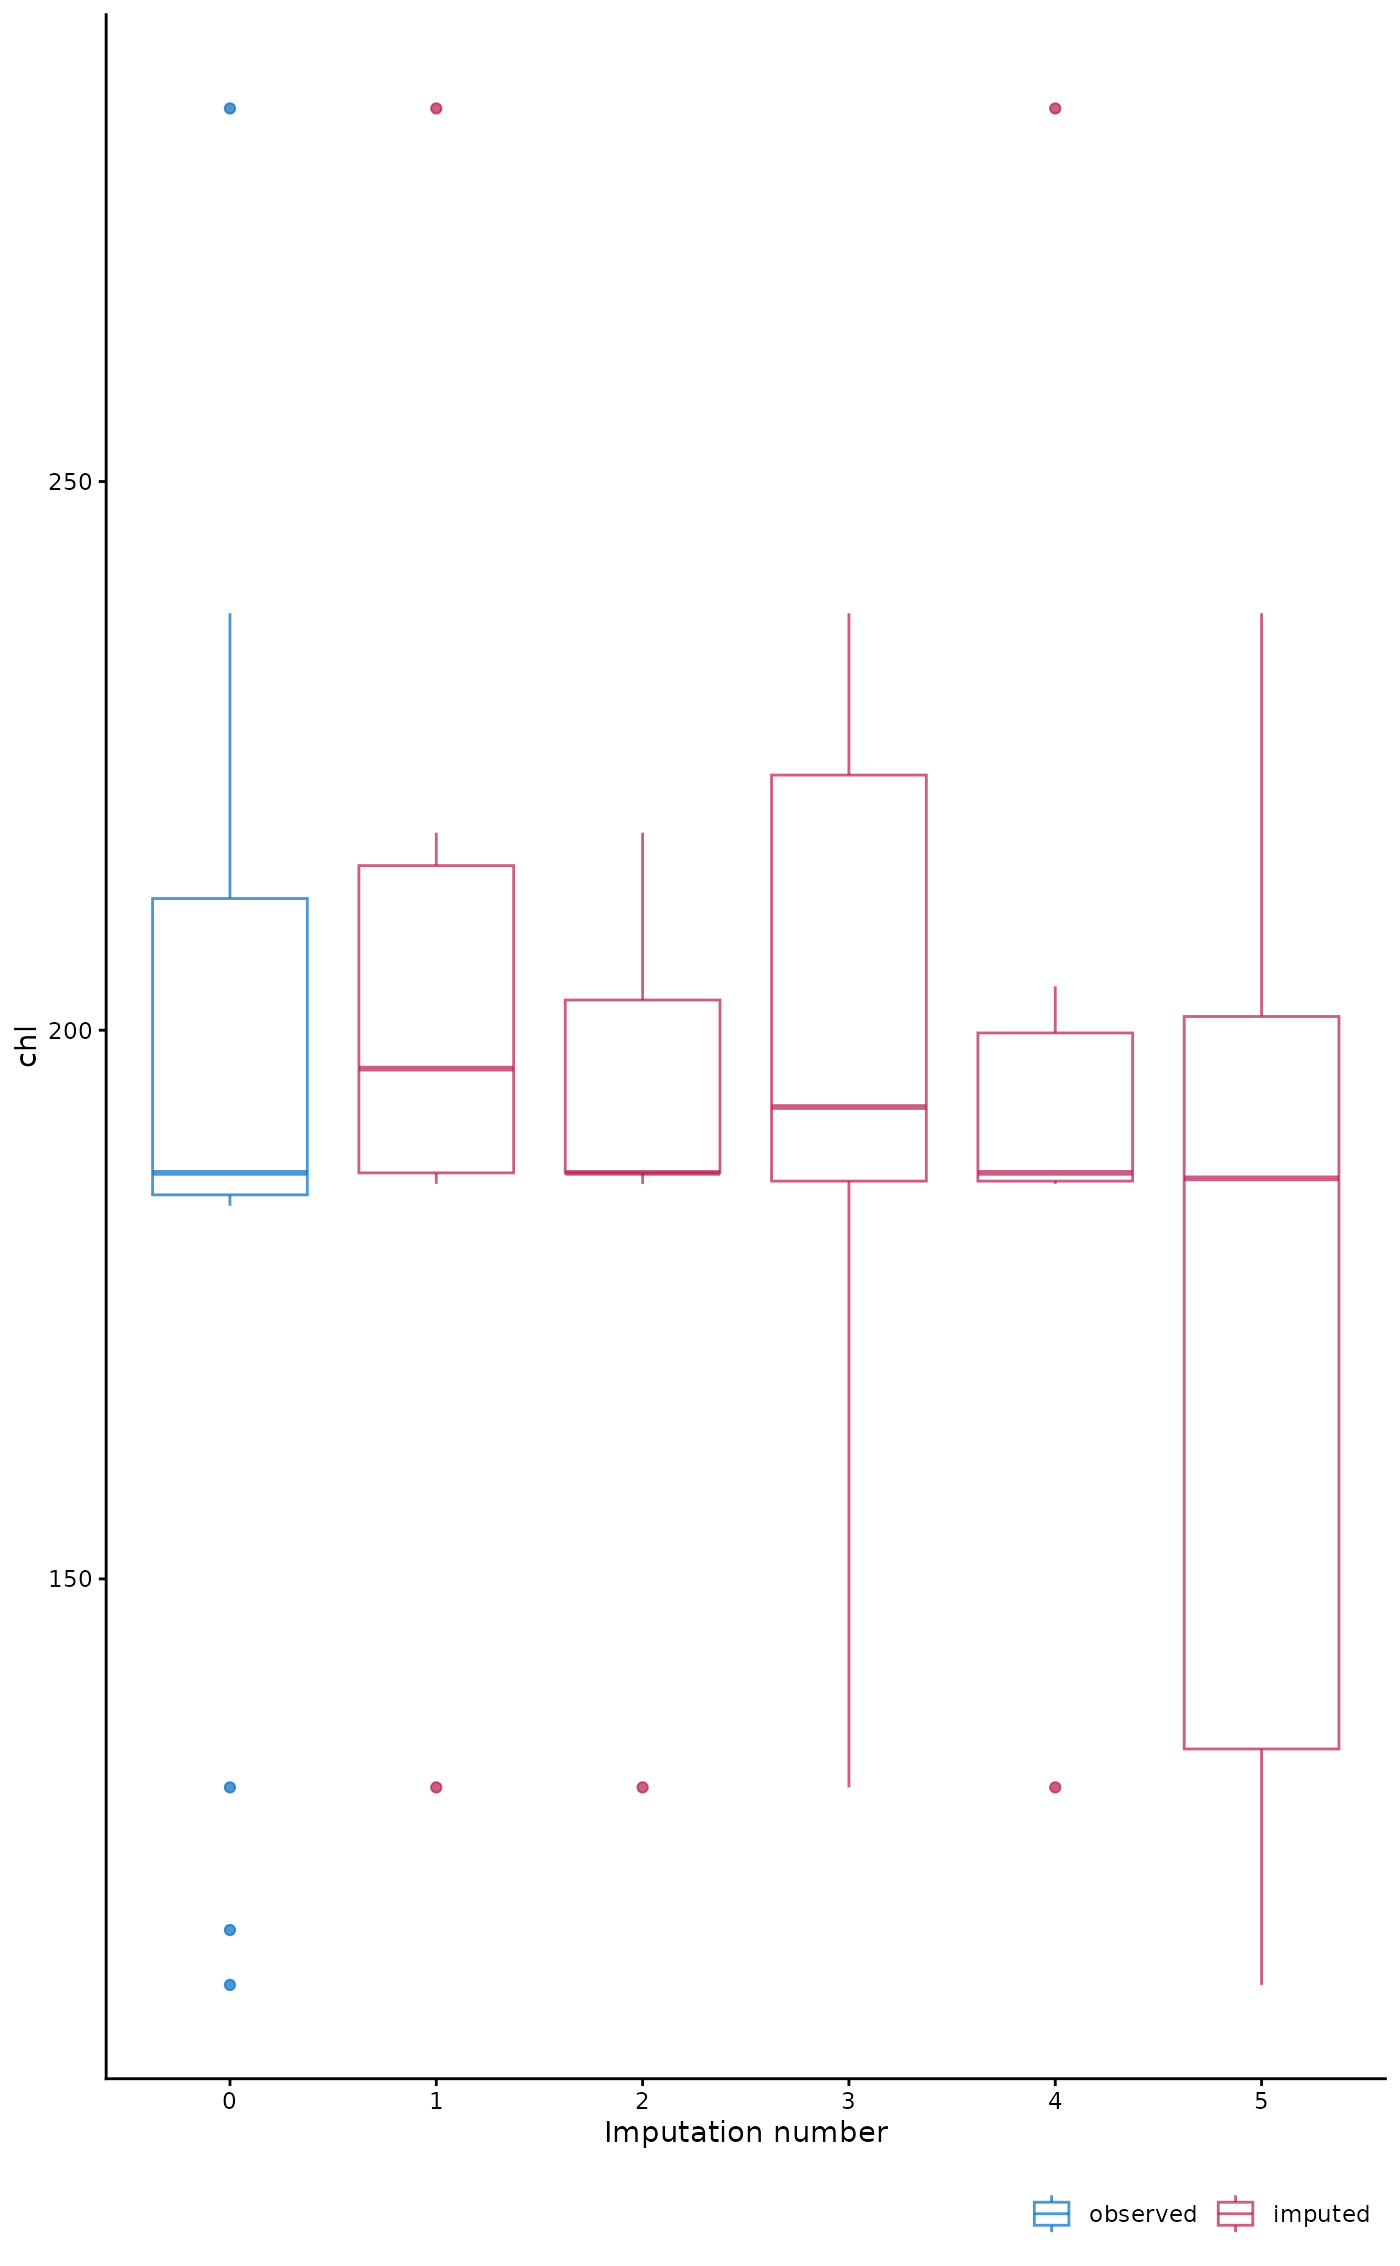
ggmice(imp, aes(x = .imp, y = chl)) + geom_boxplot() +
labs(x = "Imputation number")
# box plot by imputation
ggmice(imp, aes(x = .imp, y = chl)) + geom_boxplot() +
labs(x = "Imputation number")
 # density plot by imputation
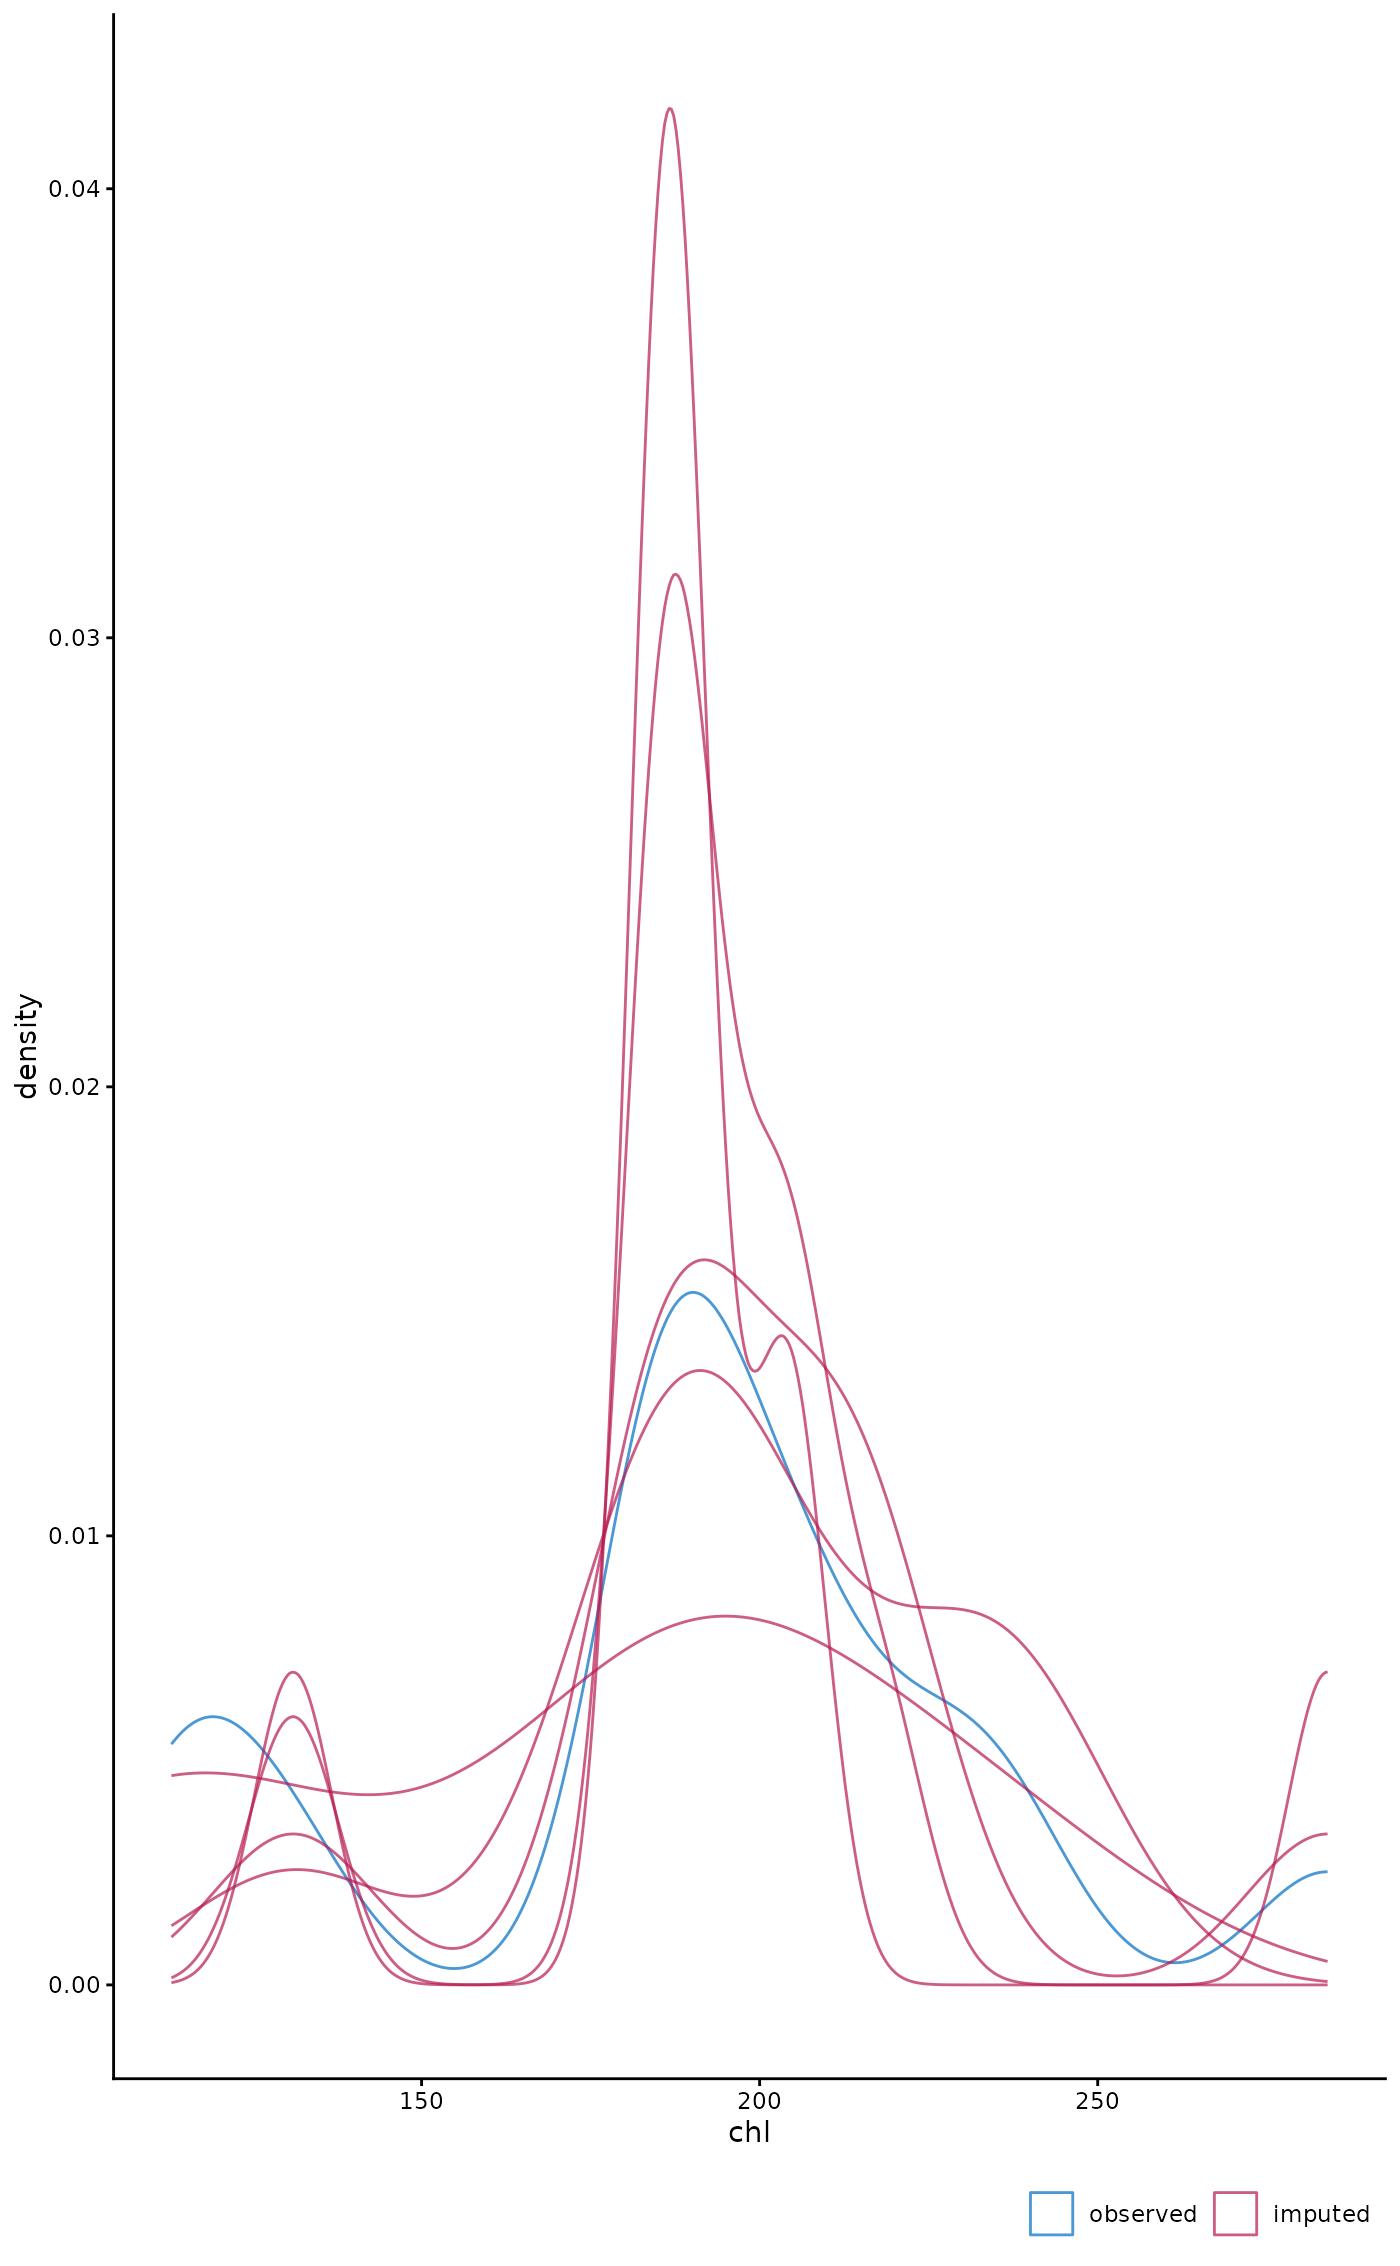
ggmice(imp, aes(x = chl, group = .imp)) + geom_density()
# density plot by imputation
ggmice(imp, aes(x = chl, group = .imp)) + geom_density()
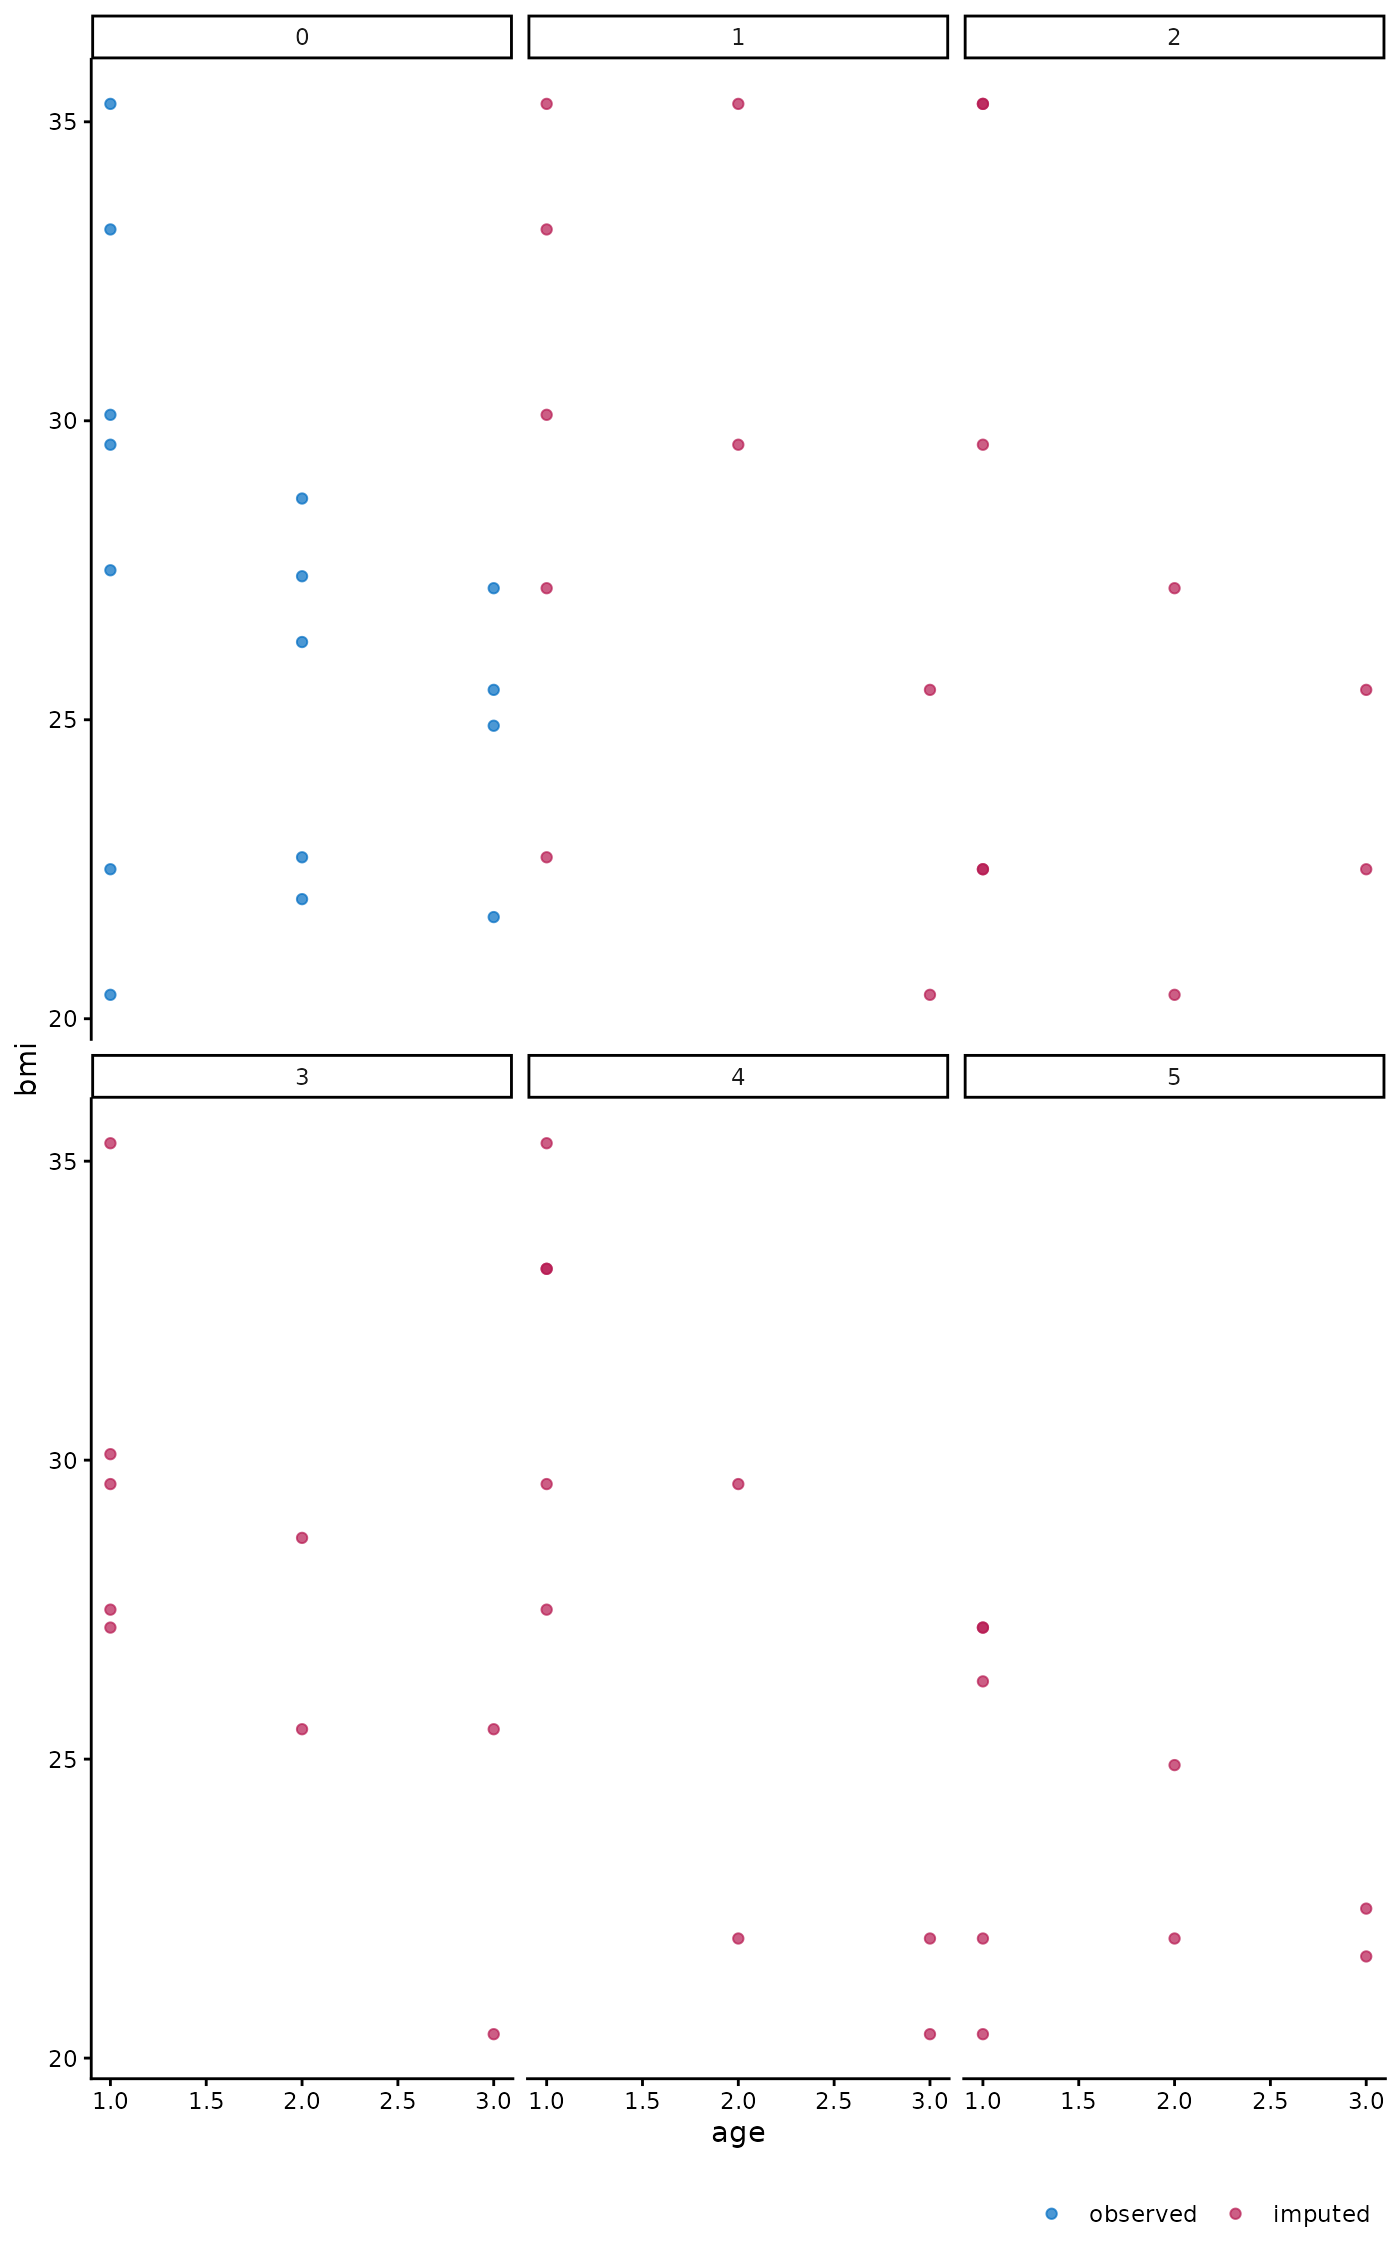
 # scatterplot faceted by imputation number
ggmice(imp, ggplot2::aes(x = age, y = bmi)) + ggplot2::geom_point() +
facet_wrap(~ .imp)
# scatterplot faceted by imputation number
ggmice(imp, ggplot2::aes(x = age, y = bmi)) + ggplot2::geom_point() +
facet_wrap(~ .imp)