![[Experimental]](figures/lifecycle-experimental.svg)
Arguments
- data
An incomplete dataset of class
data.frameormatrix.- vrb
String, vector, or unquoted expression with variable name(s), default is "all".
- ordered
Logical indicating whether rows should be ordered according to their pattern.
- rotate
Logical indicating whether the variable name labels should be rotated 90 degrees.
- grid
Logical indicating whether borders should be present between tiles.
- square
Logical indicating whether the plot tiles should be squares, defaults to squares.
Value
An object of class ggplot2::ggplot.
Examples
# plot correlations for all columns
plot_miss(mice::nhanes)
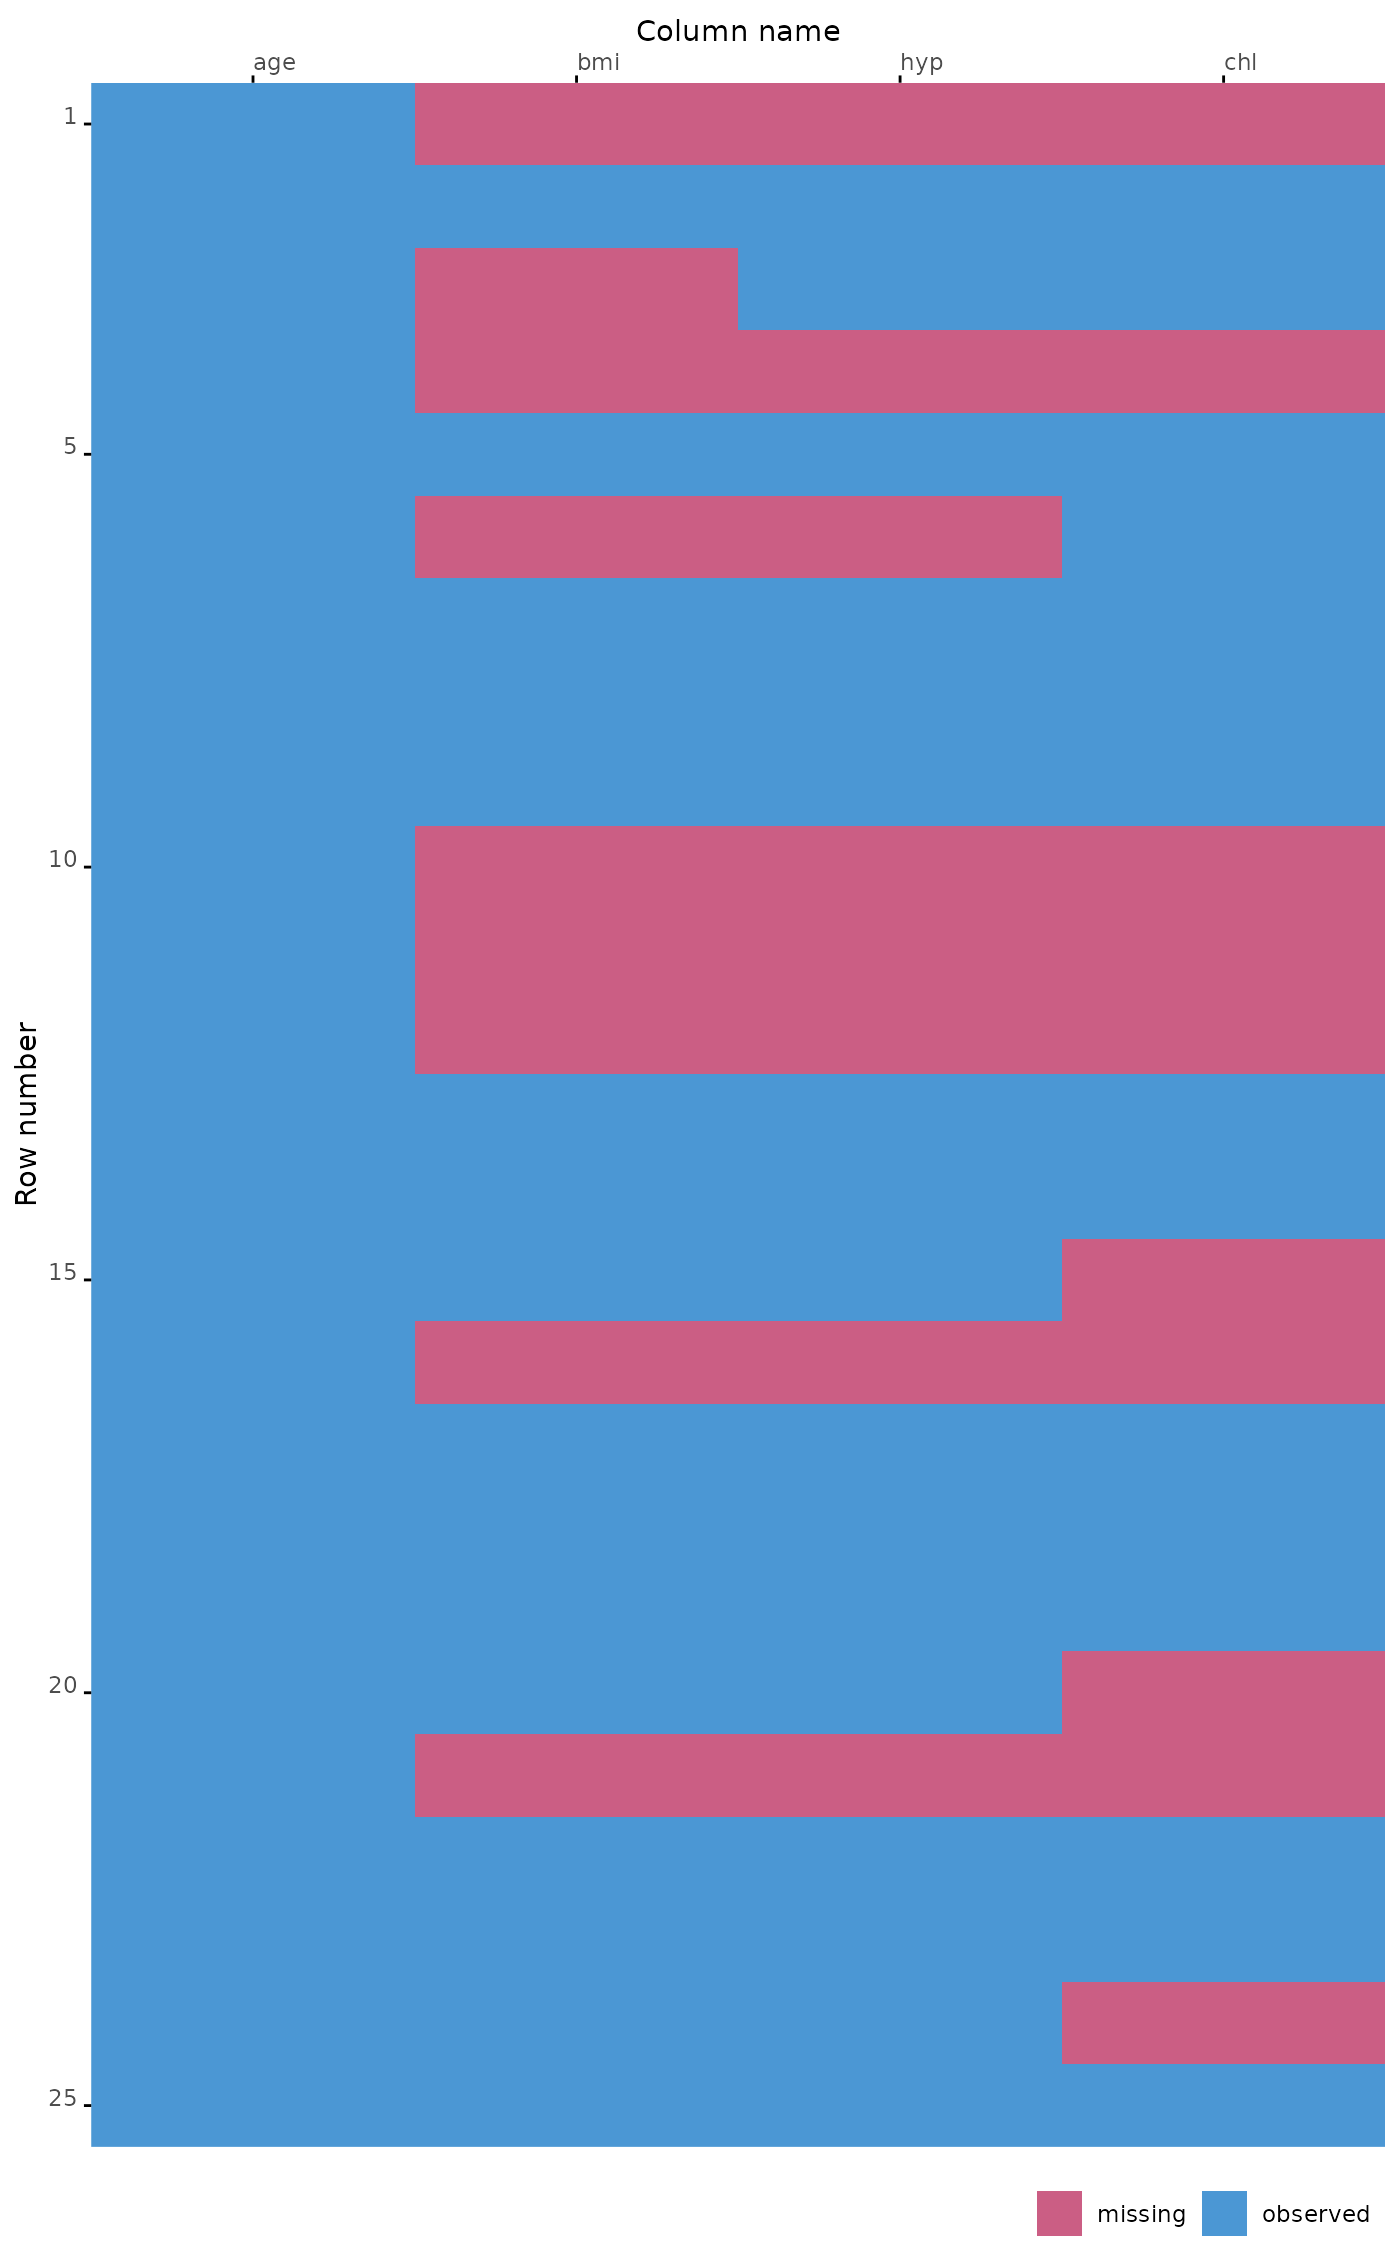 # plot correlations for specific columns by supplying a character vector
plot_miss(mice::nhanes, c("chl", "hyp"))
# plot correlations for specific columns by supplying a character vector
plot_miss(mice::nhanes, c("chl", "hyp"))
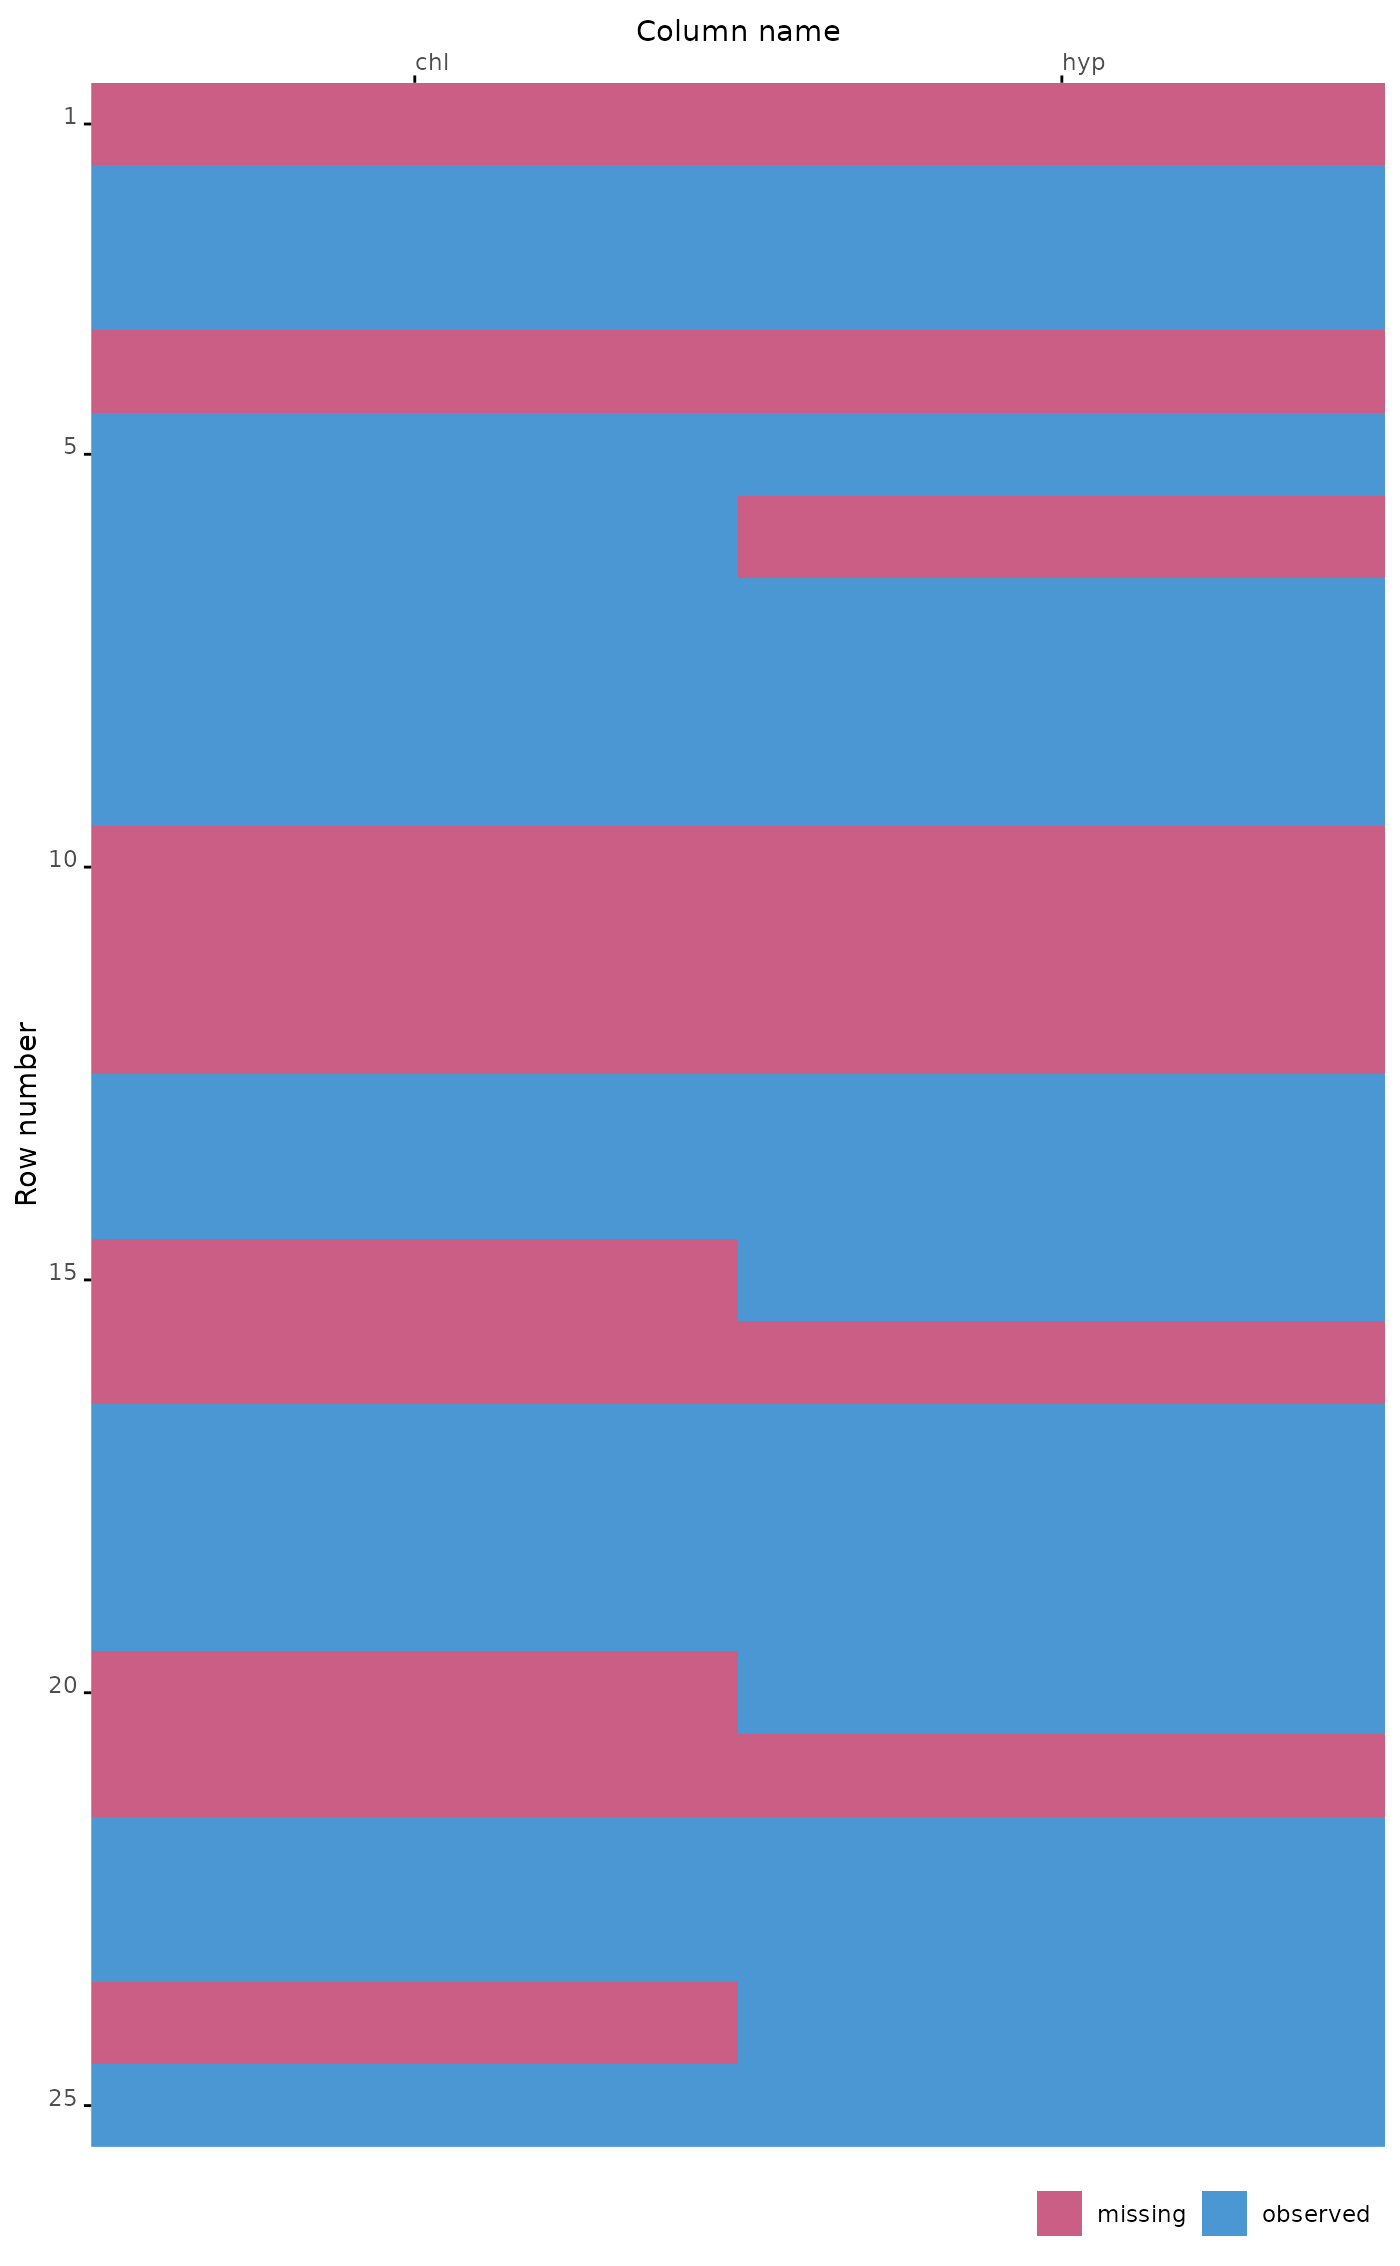
 # plot correlations for specific columns by supplying unquoted variable names
plot_miss(mice::nhanes, c(chl, hyp))
# plot correlations for specific columns by supplying unquoted variable names
plot_miss(mice::nhanes, c(chl, hyp))
 # plot correlations for specific columns by passing an object with variable names
# from the environment, unquoted with `!!`
my_variables <- c("chl", "hyp")
plot_miss(mice::nhanes, !!my_variables)
# plot correlations for specific columns by passing an object with variable names
# from the environment, unquoted with `!!`
my_variables <- c("chl", "hyp")
plot_miss(mice::nhanes, !!my_variables)
 # object with variable names must be unquoted with `!!`
try(plot_miss(mice::nhanes, my_variables))
#> Error in match_vrb(vrb, names(data)) :
#> ✖ The variable name(s) supplied to `vrb` could not be found in `data`.
#> ℹ If you supply an object with variable names from the environment, use `!!` to
#> unqote:
#> `vrb = !!my_variables`
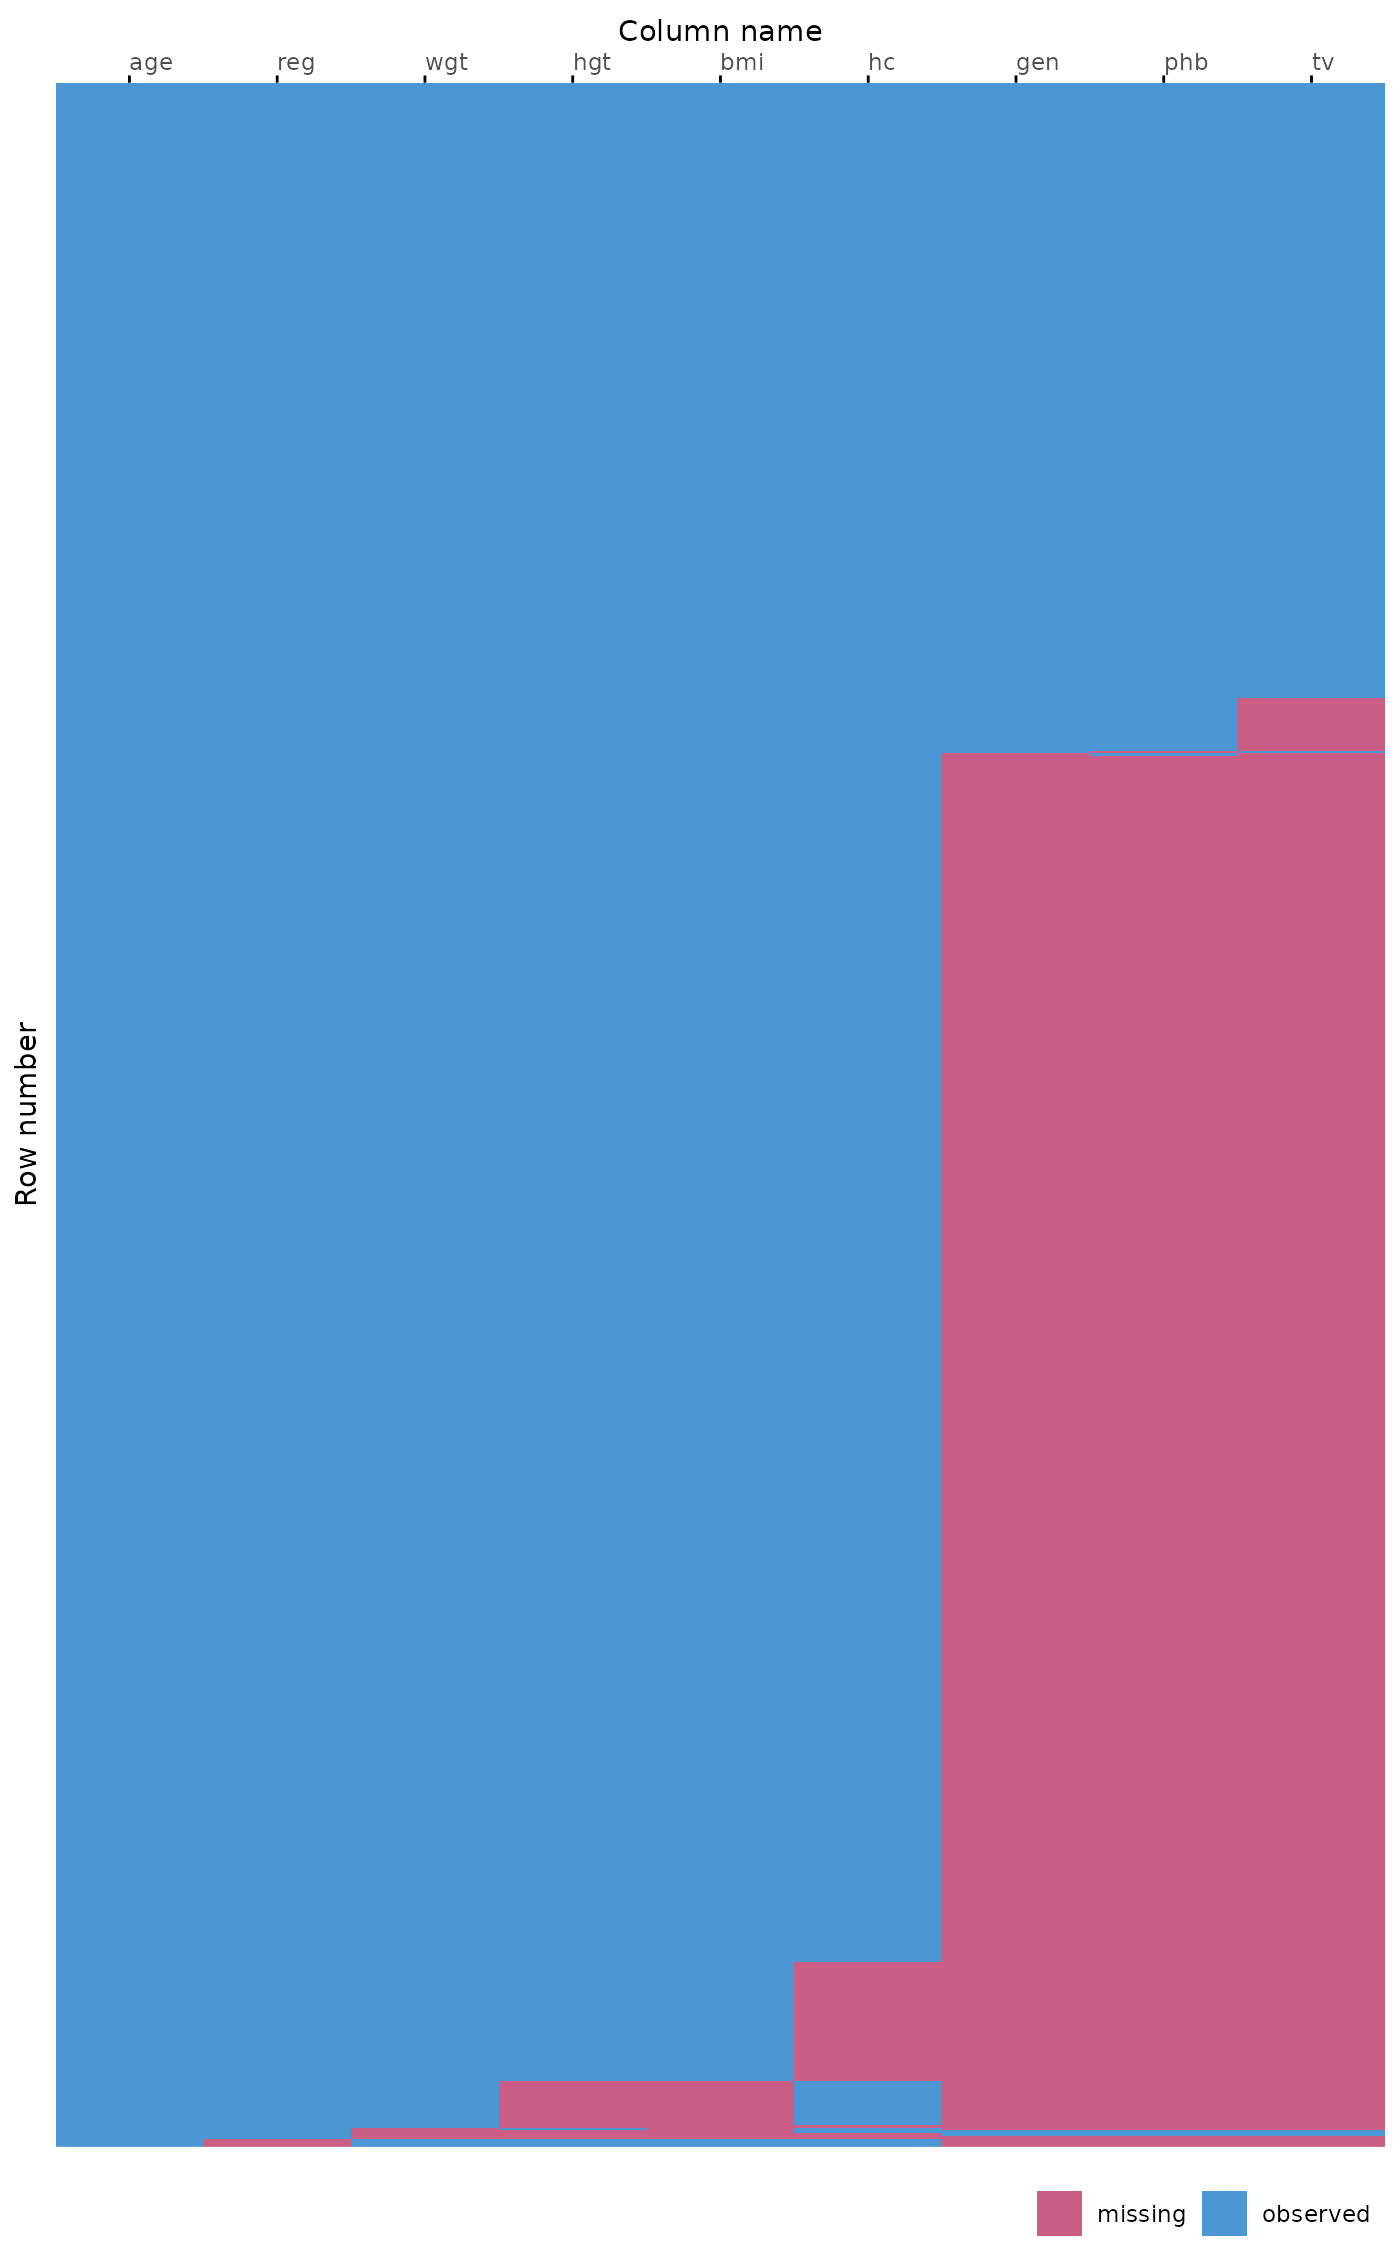
# plot larger dataset
plot_miss(mice::boys)
# object with variable names must be unquoted with `!!`
try(plot_miss(mice::nhanes, my_variables))
#> Error in match_vrb(vrb, names(data)) :
#> ✖ The variable name(s) supplied to `vrb` could not be found in `data`.
#> ℹ If you supply an object with variable names from the environment, use `!!` to
#> unqote:
#> `vrb = !!my_variables`
# plot larger dataset
plot_miss(mice::boys)
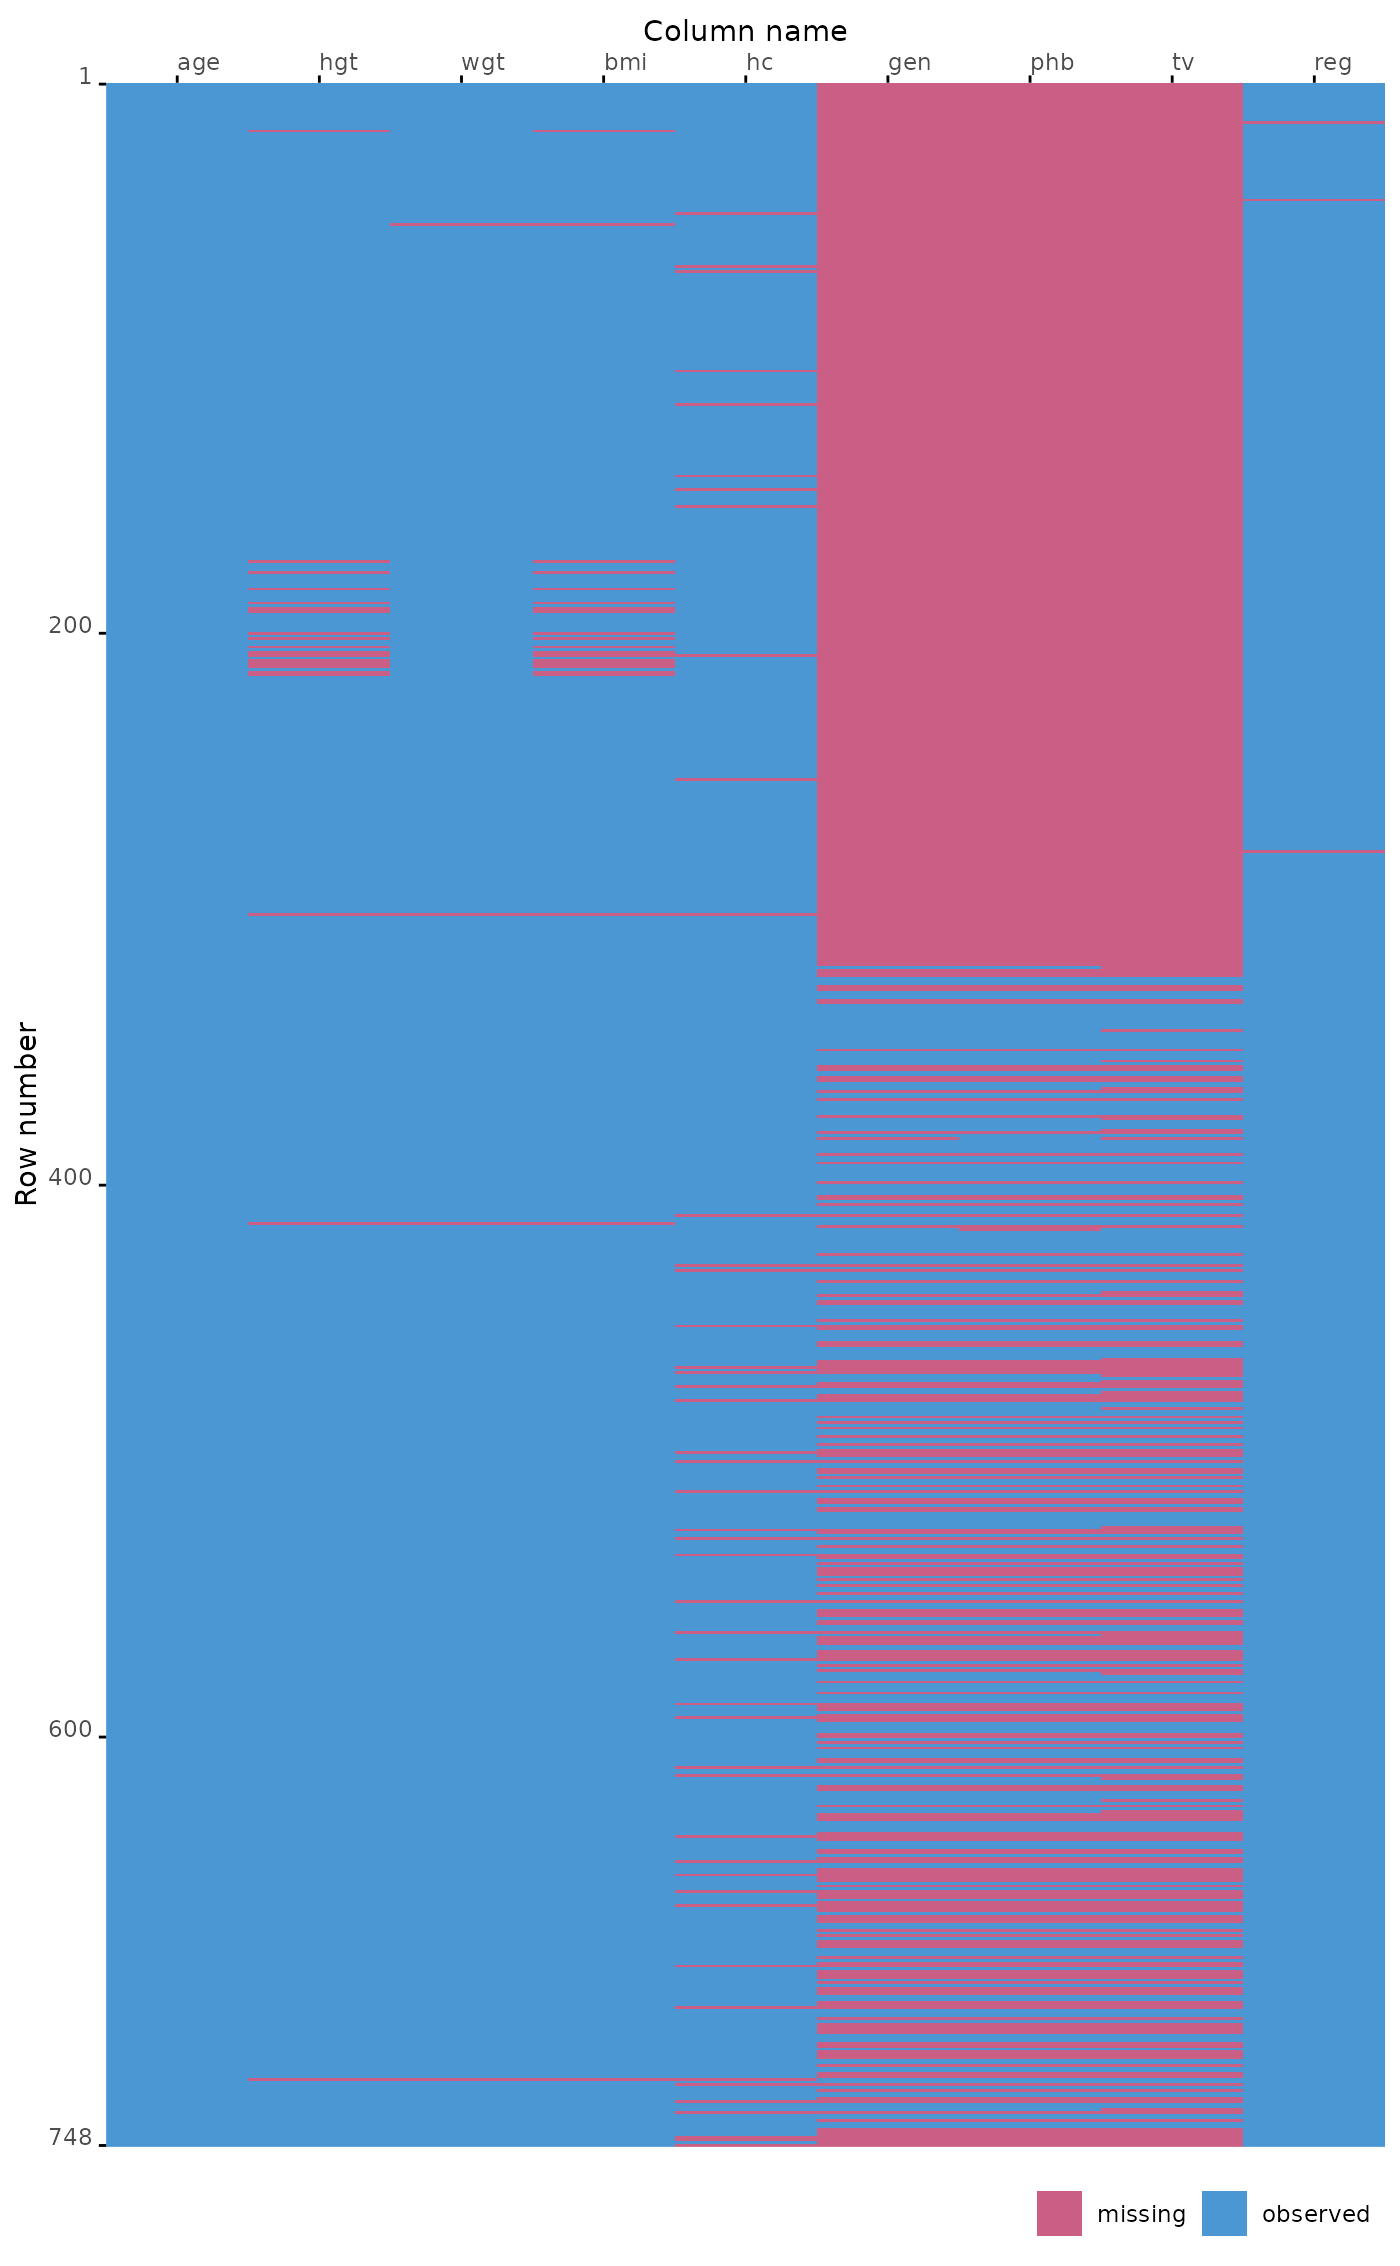 plot_miss(mice::boys, ordered = TRUE)