Plot the scaled between imputation variance for every cell as a heatmap
Source:R/plot_variance.R
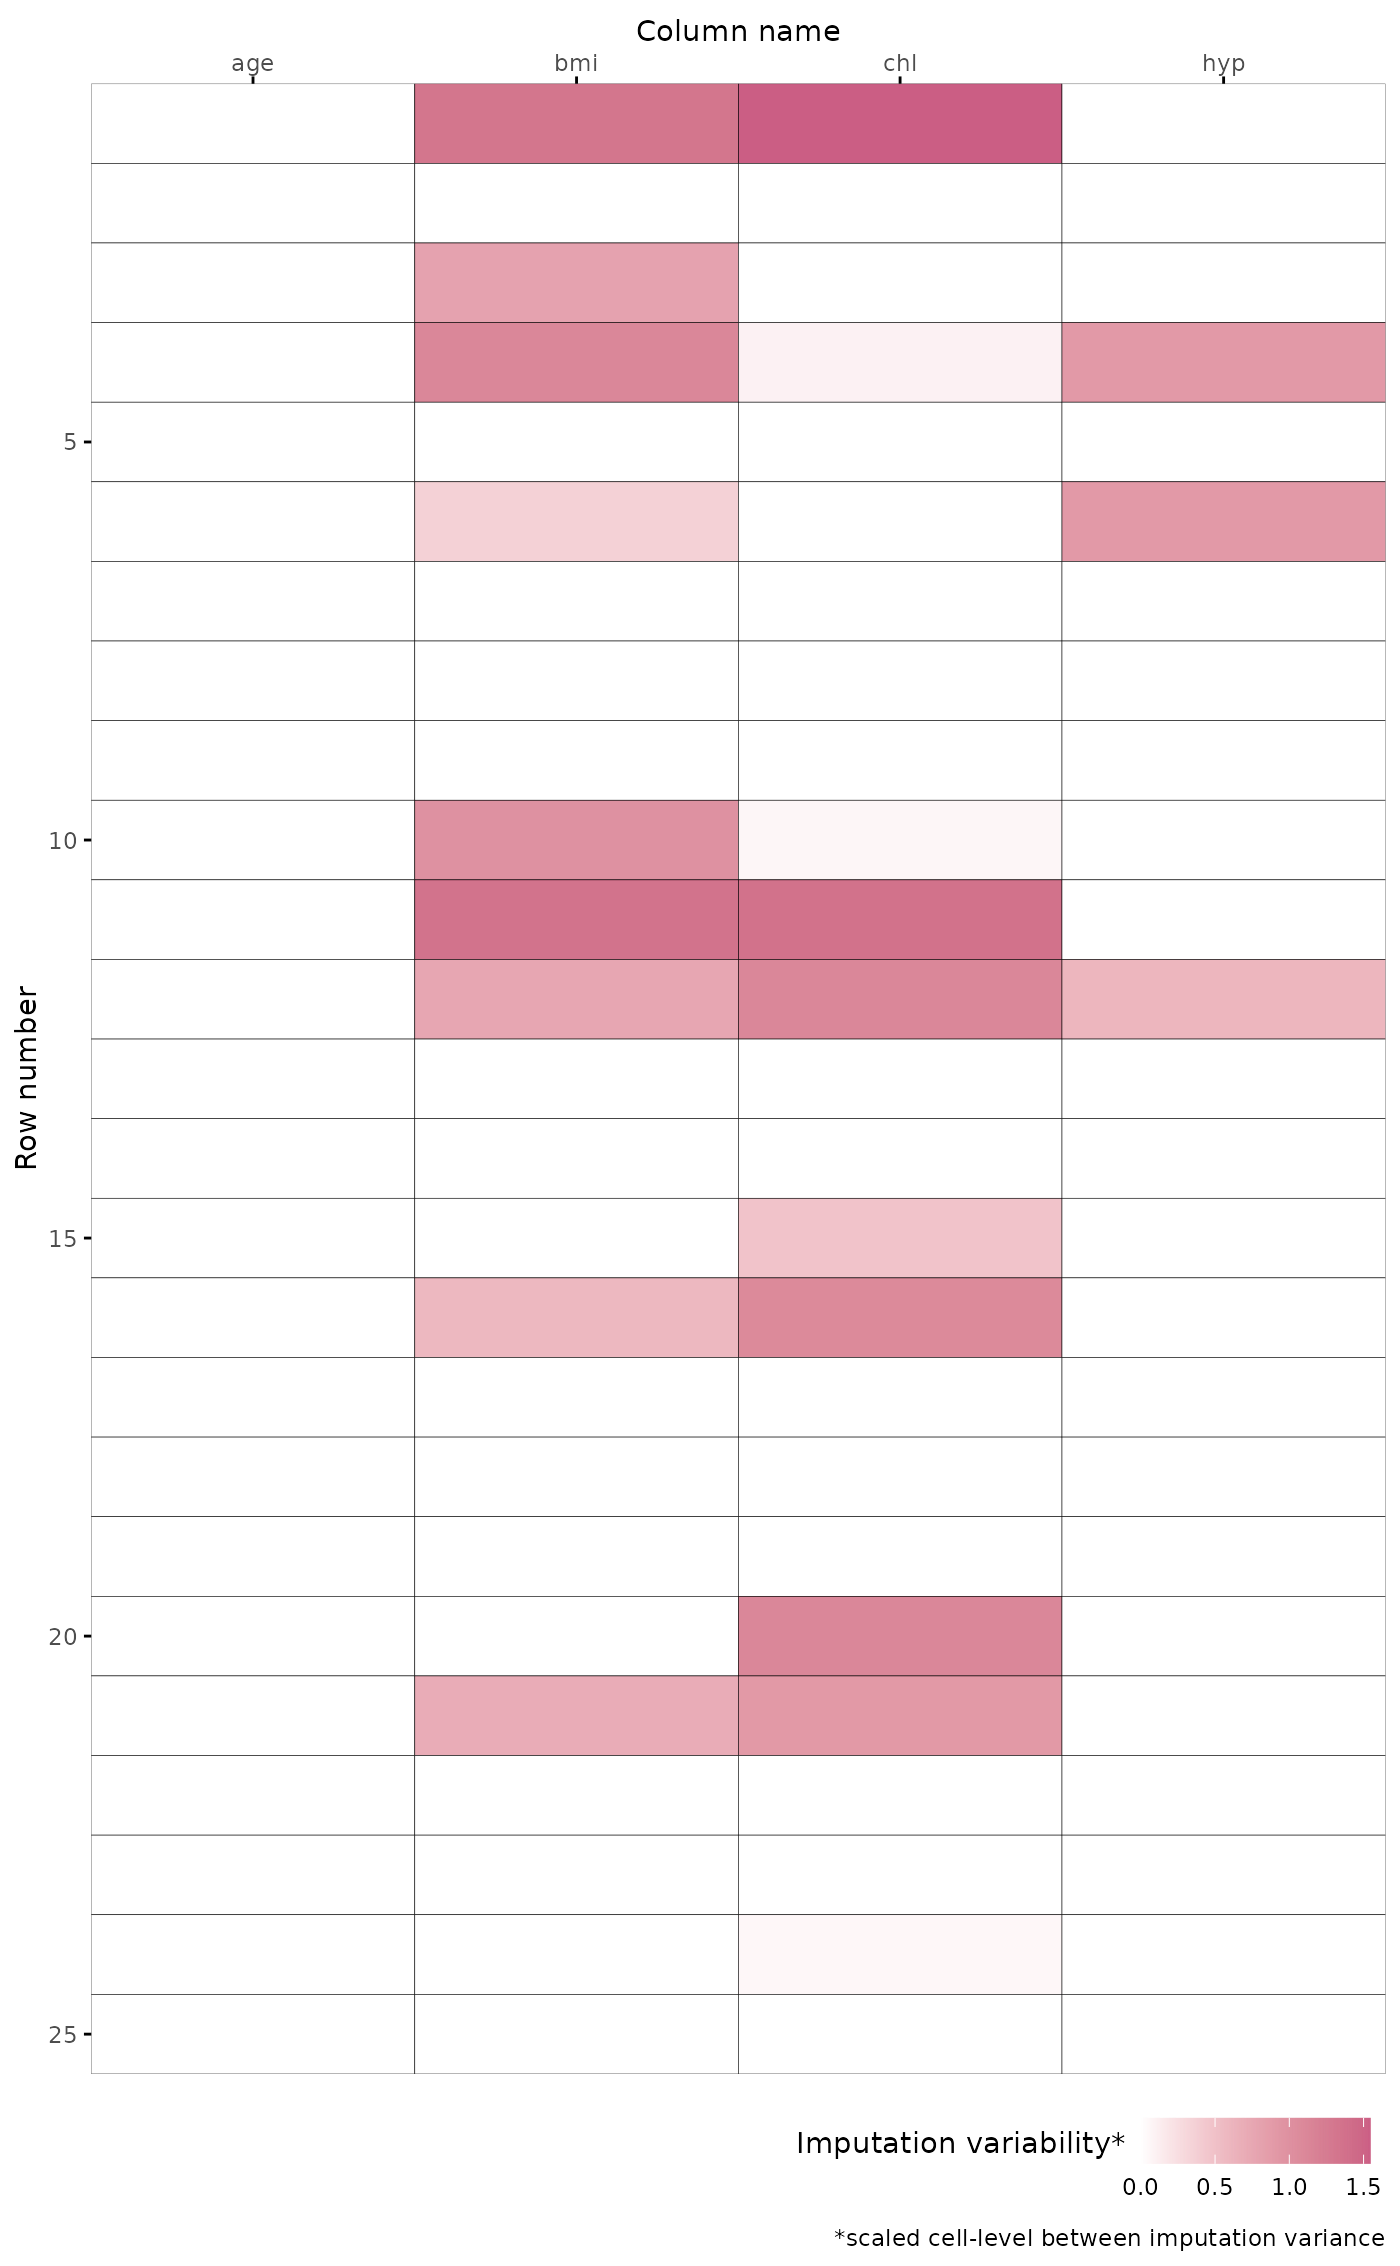
plot_variance.RdThis function plots the cell-level between imputation variance. The function
scales the variances column-wise, without centering cf. base::scale(center = FALSE)
and plots the data image as a heatmap. Darker red cells indicate more variance,
lighter cells indicate less variance. White cells represent observed cells or unobserved cells with zero between
imputation variance.
Arguments
- data
A multiply imputed object of class
mice::mids.- grid
Logical indicating whether grid lines should be displayed.
- caption
Logical indicating whether the figure caption should be displayed.