![]()

![]()
Visualizations for mice with ggplot2
Enhance a mice imputation workflow with visualizations for incomplete and/or imputed data. The ggmice functions produce ggplot objects which may be easily manipulated or extended. Use ggmice to inspect missing data, develop imputation models, evaluate algorithmic convergence, or compare observed versus imputed data.
Installation
You can install the latest ggmice release from CRAN with:
install.packages("ggmice")Alternatively, you could install the development version of ggmice from GitHub with:
# install.packages("devtools")
devtools::install_github("amices/ggmice")
Example
Inspect the missing data in an incomplete dataset and subsequently evaluate the imputed data points against observed data. See the Get started vignette for an overview of all functionalities. Example data from mice, showing height (in cm) by age (in years).
# load packages
library(ggplot2)
library(mice)
library(ggmice)
# load some data
dat <- boys
# visualize the incomplete data
ggmice(dat, aes(age, hgt)) + geom_point()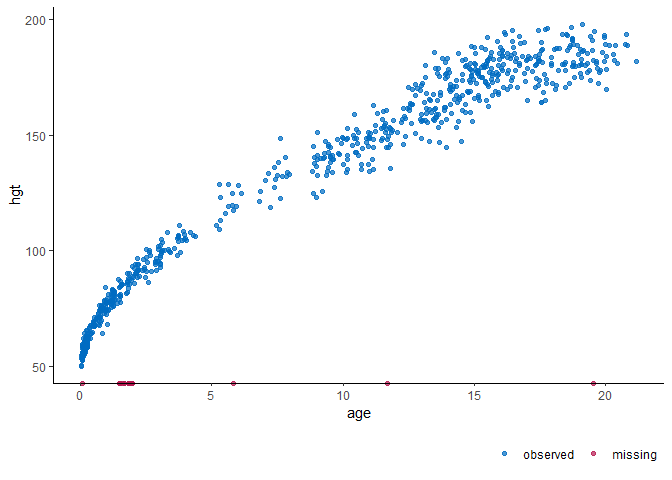
# impute the incomplete data
imp <- mice(dat, m = 1, seed = 1)
# visualize the imputed data
ggmice(imp, aes(age, hgt)) + geom_point()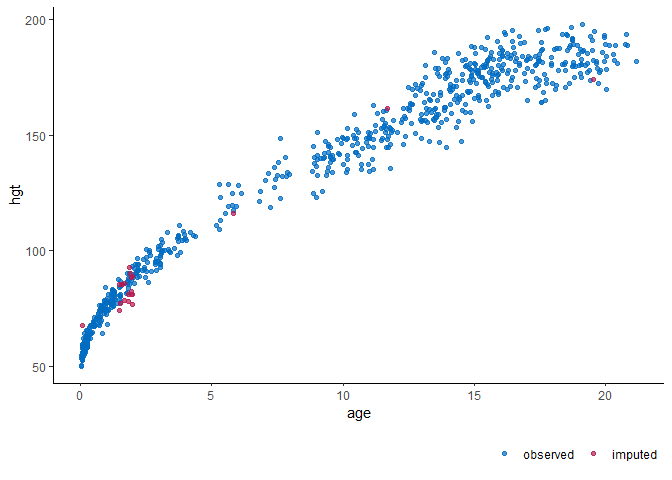
Acknowledgements
The ggmice package is developed with guidance and feedback from the Amices team. The ggmice hex is based on the ggplot2 and mice hex designs.
This project has received funding from the European Union’s Horizon 2020 research and innovation programme under ReCoDID grant agreement No 825746.
Code of Conduct
You are invited to join the improvement and development of ggmice. Please note that the project is released with a Contributor Code of Conduct. By contributing to this project, you agree to abide by its terms.

![]()