Plot the missing data pattern of an incomplete dataset
Usage
plot_pattern(
  data,
  vrb = "all",
  square = TRUE,
  rotate = FALSE,
  cluster = NULL,
  npat = NULL,
  caption = TRUE
)
Arguments
- data
An incomplete dataset of class
data.frameormatrix.- vrb
String, vector, or unquoted expression with variable name(s), default is "all".
- square
Logical indicating whether the plot tiles should be squares, defaults to squares to mimic
mice::md.pattern().- rotate
Logical indicating whether the variable name labels should be rotated 90 degrees.
- cluster
Optional character string specifying which variable should be used for clustering (e.g., for multilevel data).
- npat
Optional numeric input specifying the maximum number of missing data patterns to be visualized, defaults to all patterns.
- caption
Logical indicating whether the figure caption should be displayed.
Value
An object of class ggplot2::ggplot.
Examples
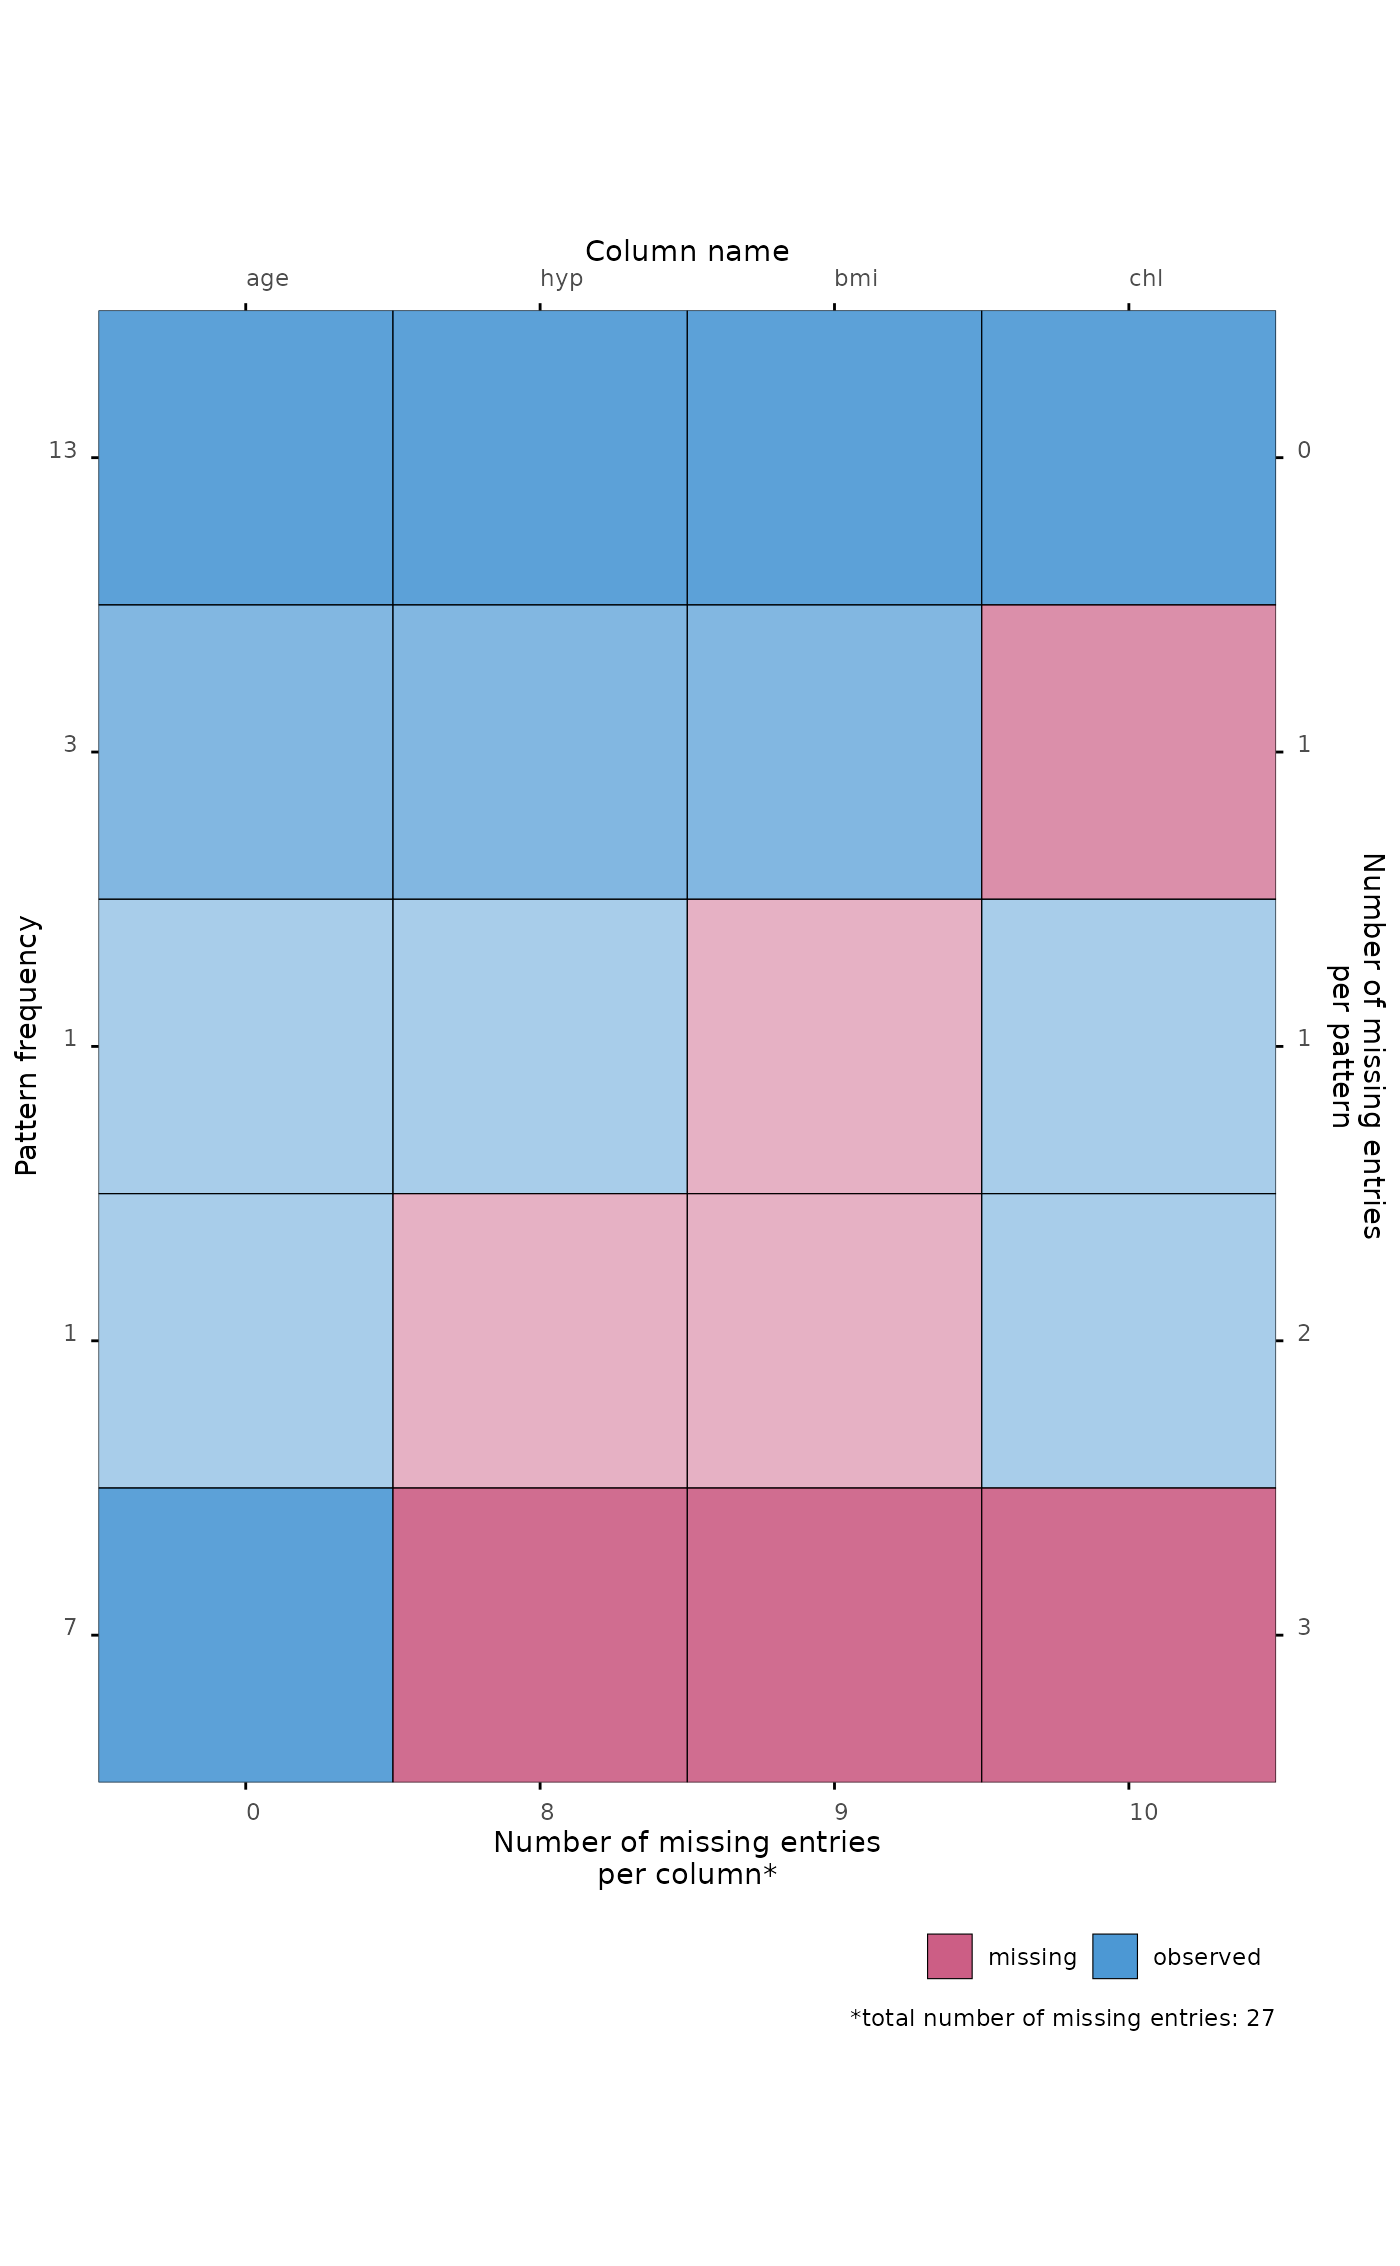
# plot missing data pattern for all columns
plot_pattern(mice::nhanes)
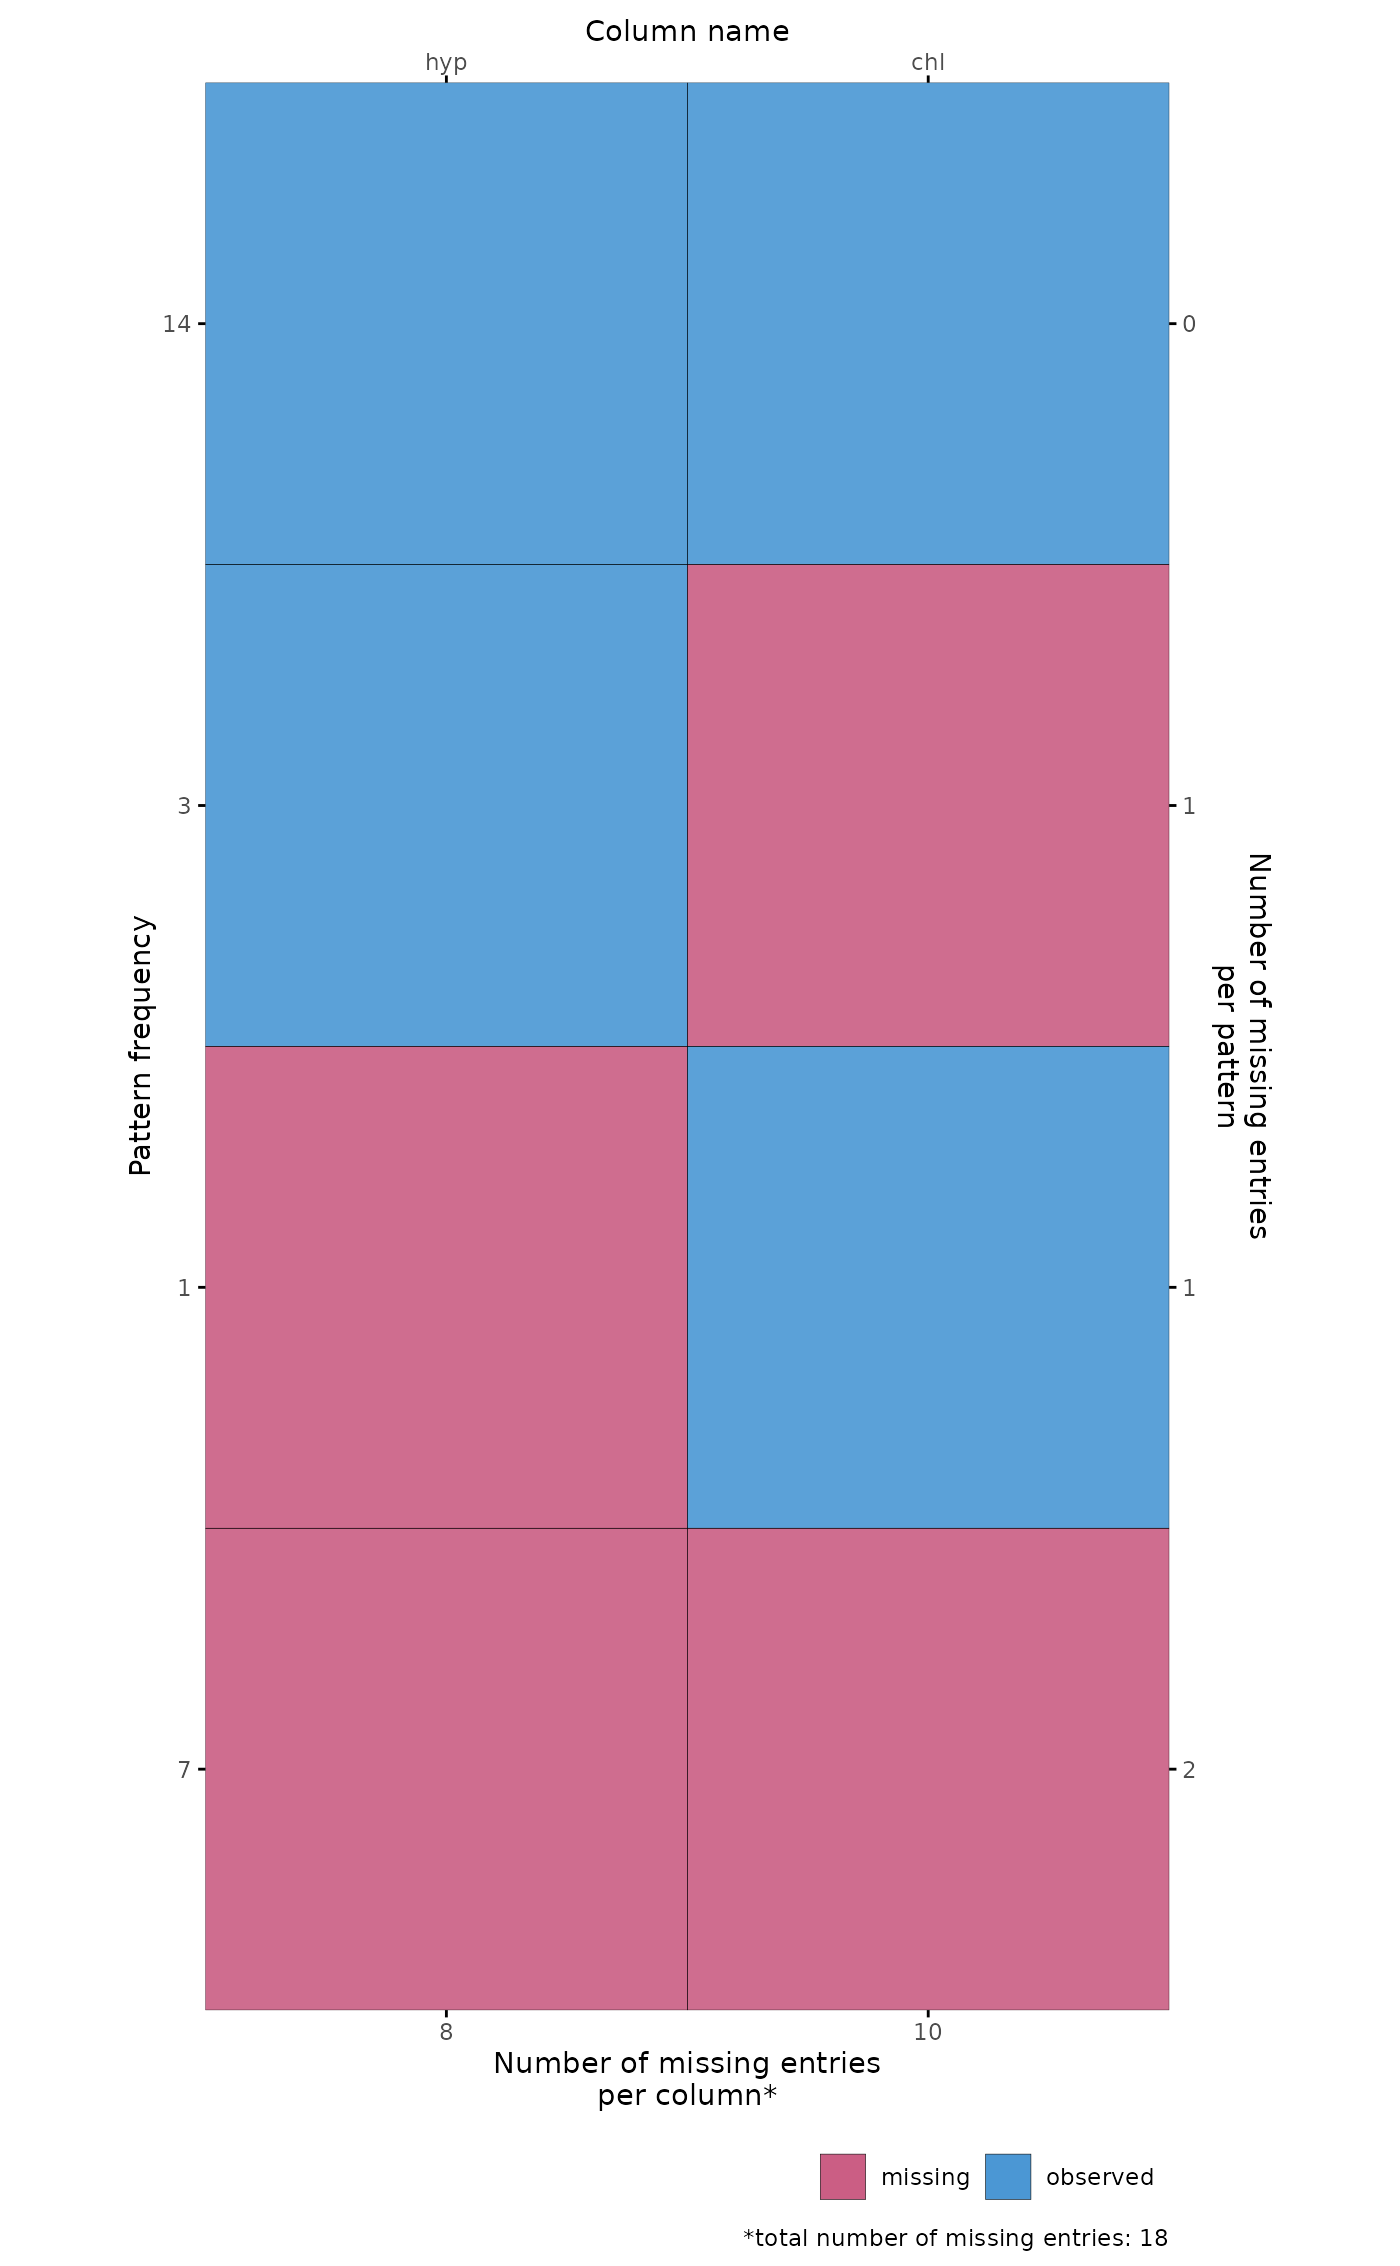
 # plot missing data pattern for specific columns by supplying a character vector
plot_pattern(mice::nhanes, c("chl", "hyp"))
# plot missing data pattern for specific columns by supplying a character vector
plot_pattern(mice::nhanes, c("chl", "hyp"))
 # plot missing data pattern for specific columns by supplying unquoted variable names
plot_pattern(mice::nhanes, c(chl, hyp))
# plot missing data pattern for specific columns by supplying unquoted variable names
plot_pattern(mice::nhanes, c(chl, hyp))
 # plot missing data pattern for specific columns by passing an object with variable names
# from the environment, unquoted with `!!`
my_variables <- c("chl", "hyp")
plot_pattern(mice::nhanes, !!my_variables)
# plot missing data pattern for specific columns by passing an object with variable names
# from the environment, unquoted with `!!`
my_variables <- c("chl", "hyp")
plot_pattern(mice::nhanes, !!my_variables)
 # object with variable names must be unquoted with `!!`
try(plot_pattern(mice::nhanes, my_variables))
#> Error in match_vrb(vrb, names(data)) :
#> ✖ The variable name(s) supplied to `vrb` could not be found in `data`.
#> ℹ If you supply an object with variable names from the environment, use `!!` to
#> unqote:
#> `vrb = !!my_variables`
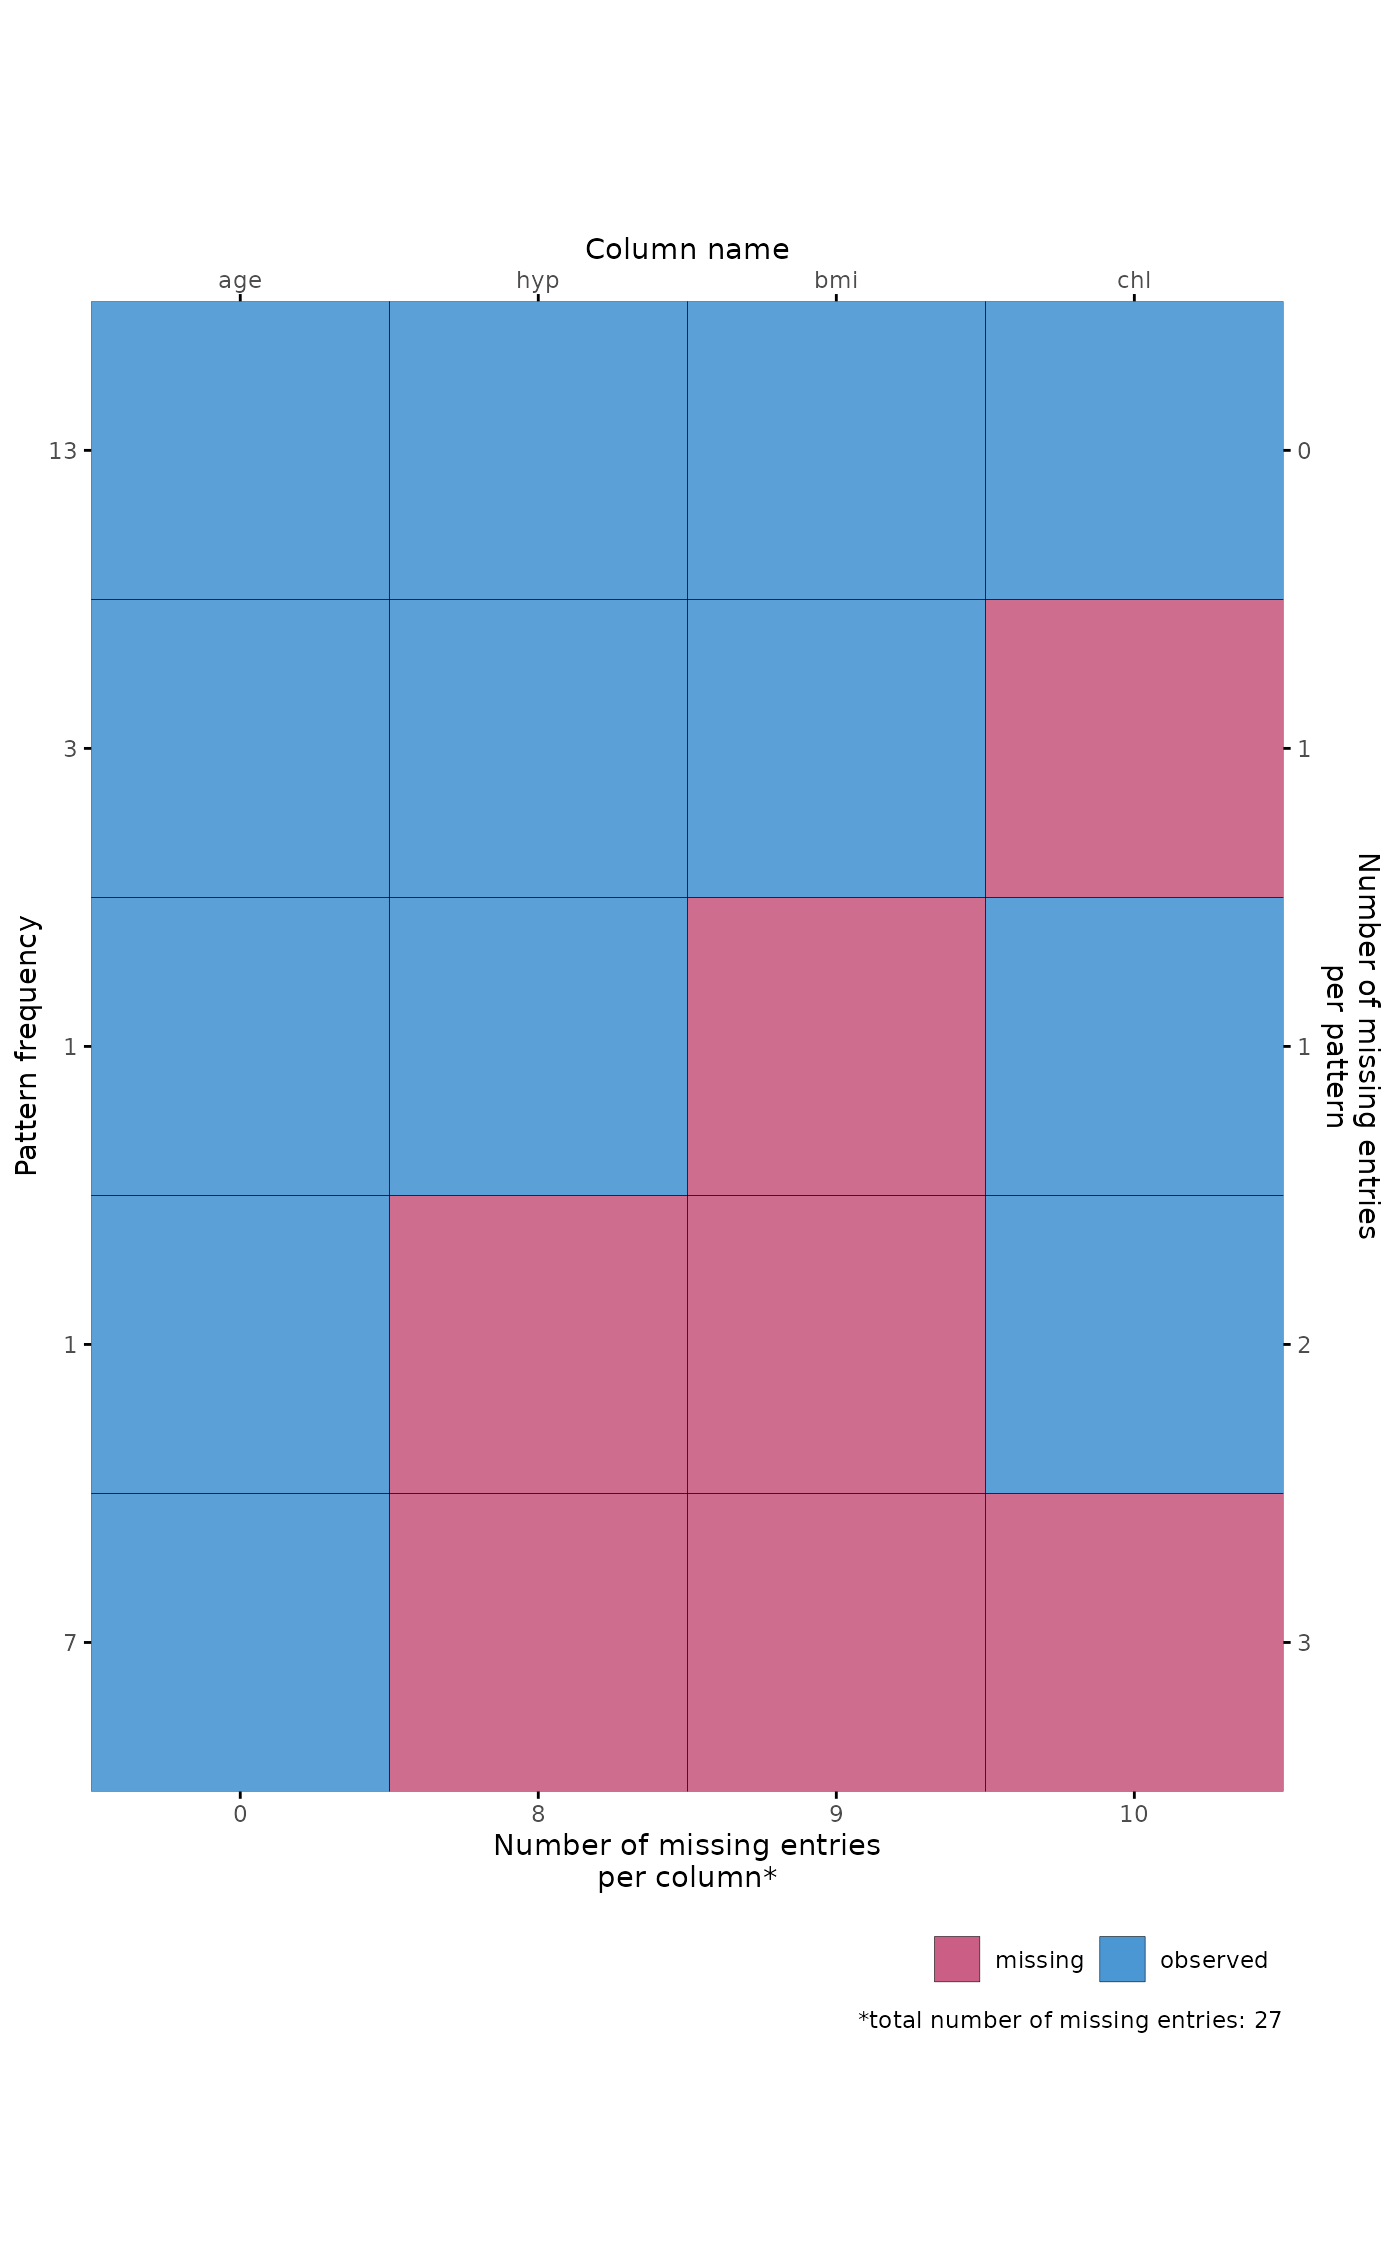
# plot missing data pattern by cluster
plot_pattern(mice::nhanes, cluster = "age")
# object with variable names must be unquoted with `!!`
try(plot_pattern(mice::nhanes, my_variables))
#> Error in match_vrb(vrb, names(data)) :
#> ✖ The variable name(s) supplied to `vrb` could not be found in `data`.
#> ℹ If you supply an object with variable names from the environment, use `!!` to
#> unqote:
#> `vrb = !!my_variables`
# plot missing data pattern by cluster
plot_pattern(mice::nhanes, cluster = "age")